Download
1 / 23
240 likes | 401 Views
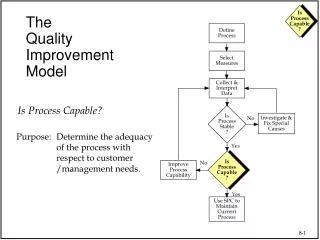
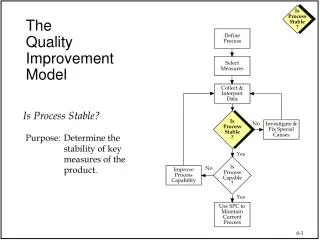
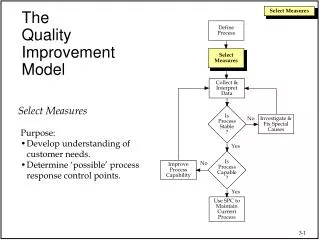
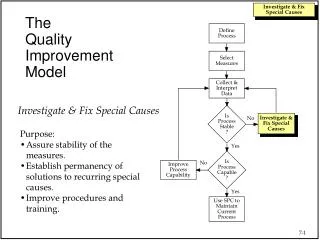
The Quality Improvement Model. Define Process. Select Measures. Collect & Interpret Data. Improve Process Capability. Is Process Stable ?. Investigate & Fix Special Causes. No. Purpose: Determine/identify fundamental changes to the process to improve capability. Yes. Is Process Capable ?.

E N D
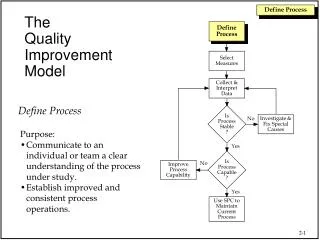
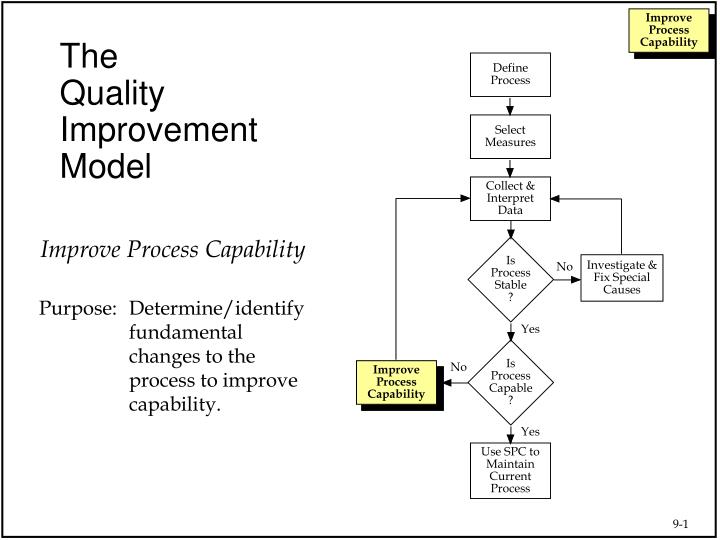
TheQualityImprovementModel Define Process Select Measures Collect & Interpret Data Improve Process Capability IsProcessStable? Investigate & Fix Special Causes No Purpose: Determine/identify fundamental changes to the process to improve capability. Yes IsProcessCapable? No Improve Process Capability Yes Use SPC to Maintain Current Process
Improving Stable Processes • Common causes of variation usually cannot be reduced by trying to explain the difference between high and low points when a process is stable. • All of the data, not just the high and low points, are relevant to further analysis. • Aspects of the system that are always present will need to be changed to improve common cause variation. • Stable systems usually require managerial attention for improvement. Fundamental changes in the system are often required. Source: Brian Joiner
Week 1 2 3 4 5 6 7 8 9 10 11 12 13 14 15 16 17 18 19 20 Total # Errors 15 22 18 10 13 9 27 12 24 22 8 8 26 16 20 10 16 9 15 20 320 Control Chart 35 30 UCL=28.0 Number of Errors 25 20 Avg=16.0 15 10 5 LCL=4.0 0 5 10 15 20 Week Order Entry Process It has been decided that this process requires further improvement How do we go about it?
Description Number of Errors Incorrect Account Number 72 Error in Order Amount 168 Inadequate Billing Information 17 Priority Code Not Checked 25 Incomplete Shipping Instructions 14 Other Errors 24 TOTAL 320 Order Entry Errors by Type Pareto Chart 180 160 140 120 100 80 60 40 20 0 Error in Incorrect Priority Inadequate Incomplete Other Errors Order Account Code Not Billing Shipping Amount Number Checked Information Instructions Type Error
Week 21 22 23 24 25 26 27 28 29 30 31 32 33 34 35 Total # Errors 16 10 13 6 8 10 6 5 4 6 1 5 0 1 2 93 Control Chart 35 Process Improvements Begin 30 UCL=28.0 Number of Errors 25 20 Avg=16.0 15 10 5 LCL=4.0 0 5 10 15 20 25 30 35 Week Limits based on first 20 weeks of data Order Entry ProcessResults of efforts to reduce errors in order amount.
Description Number of Errors Incorrect Account Number 42 Error in Order Amount 8 Inadequate Billing Information 7 Priority Code Not Checked 17 Incomplete Shipping Instructions 9 Other Errors 10 TOTAL 93 Pareto Chart 45 40 35 30 25 20 15 10 5 0 Incorrect Priority Incomplete Error in Inadequate Other Errors Account Code Not Shipping Order Billing Number Checked Instructions Amount Information Type Error Order Entry Errors by Type
Improving Stable Processes- Instrument Measures Common Problems with Stable Processes Off Target Excess Variation Lower Spec Upper Spec Lower Spec Upper Spec Or, Both
Improving Stable Processes- Instrument Measures Common Improvement Techniques • Targeting Processes - Designed Experiments • Change process variables in a planned manner to determine the effects of the variables on level and variability. • Design of Experiments Course • Reducing Variation - Use Process Knowledge • Break out process steps (Process Map and C&E information) • Isolate sources of variability (Exploratory Data Analysis or Designed Experiment) • Separate out common causes (stratification – Applied Statistical Methods Course) • Exploratory Data Analysis (Applied Statistical Methods Course) • Multi-Vary Studies in Six Sigma • Analysis on existing process data • Done on key variables identified in C&E or FMEA
Breaking Out Process Steps Use C&E matrix as a place to start data collection and analysis.
First Measurement Second Measurement Isolating Sources of Variability“Polymer Manufacturing Process” Conduct a study to evaluate measurement variability of b*. Two b* measurements are done on each sample. 3.0 2.5 2.0 1.5 1.0 0.5 0 b* Duplicate Measurements on Same Sample 1 2 3 4 5 6 7 8 9 Sample Possible Actions: Concentrate on improving the measurement process (Previous Module)
Run Chart Proportion 0.20 0.15 Late 0.10 0.05 0.00 2 4 6 8 10 12 14 16 18 20 22 24 26 28 30 Week International orders <10% of total orders International orders 10-20% of total orders International orders >20% of total orders Separating Out Common Causes“Shipping Process” Possible Actions: Improve process for shipping of international orders.
Minitab: Comparing Two or More Samples • Open Mintab Software • Open Color Round Robin Data in the Mintab Datasets Folder and follow the directions in the notes below. Note: The ASM course spends more time discussing Planning, Data Collection, Analysis and Interpretation from experiments similar to the one above.
Comparing Two or More Labs Follow the instructions in the notes to perform the comparisons.
Comparing Two or More Labs … Individual 95% CIs For Mean Based on Pooled StDev Level N Mean StDev ---+---------+---------+---------+------ HART 24 -1.7658 0.2235 (-*--) Kuantan 41 -1.3346 0.1369 (-*) TED 37 -1.0568 0.0846 (-*-) ---+---------+---------+---------+------ -1.75 -1.50 -1.25 -1.00 Pooled StDev = 0.1476 Tukey 95% Simultaneous Confidence Intervals All Pairwise Comparisons among Levels of Lab Individual confidence level = 98.09% Lab = HART subtracted from: Lab Lower Center Upper --+---------+---------+---------+------- Kuantan 0.3408 0.4312 0.5216 (--*--) TED 0.6169 0.7091 0.8012 (--*--) --+---------+---------+---------+------- -0.30 0.00 0.30 0.60 Lab = Kuantan subtracted from: Lab Lower Center Upper --+---------+---------+---------+------- TED 0.1981 0.2779 0.3576 (-*--) --+---------+---------+---------+------- -0.30 0.00 0.30 0.60
Hypotheses: Does Film IV, CHDM and DEG Effect Shrink Stress?
Minitab : Analyze Relationships Between Two Continuous Variables • Open Minitab Software. • Open Shrink Stress in the Minitab Datasets Folder. • Follow the instructions below to create fitted line plots of the data.
Analyze Relationships Between Two Continuous Variables What conclusions do you make from the analysis?
Outputs Variables Process Products or Services 103.4 92.6 2345 Designed Experiments Input Variables Making planned and deliberate changes to the process input variables to determine the effect on the output variables. Properly designed experiments can yield useful cause-effect information.
Designed Experiments - Example Objective: Choose a formulation for a new EMBRACE product. These 16 conditions were done on a manufacturing line in Kingsport. Material was taken to customers and run. Customer fitness for use measures will aid in determining new EMBRACE fromulation.
Review • Improving Stable Processes takes intervention • All of the data is important, not just the "Special" Causes • Exploratory Data Analysis (EDA) on historical data • Use the C&E Matrix and the FMEA to determine where to start • Look for trends • Look for differences among qualitative variables (instruments, etc.) • Information will be used in control plan • Variance Component Breakdowns (Test and Process) • Designed Experiments on Key Inputs • Key Inputs determined by C&E, FMEA and EDA • Information will be used in control plan
Exercise 1.) Your Catapult Team should complete page 12 of the “Catapult Process” handout. Limit yourselves to 30 minutes for this exercise.