Download
1 / 30
431 likes | 1.7k Views
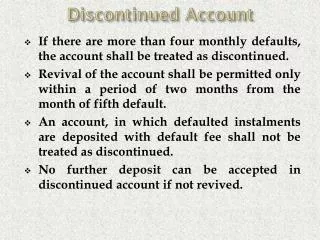
Discontinued Operations. Parts of a company’s operations that are eliminated A one-time occurrence Income/loss from discontinued operations separately reported Net of taxes Gain/loss from disposal of discontinued operations separately reported Net of taxes. Extraordinary Items.

E N D
Discontinued Operations • Parts of a company’s operations that are eliminated • A one-time occurrence • Income/loss from discontinued operations separately reported • Net of taxes • Gain/loss from disposal of discontinued operations separately reported • Net of taxes
Extraordinary Items • Events that are • Unusual in nature • Abnormal • Infrequent in occurrence • Not reasonably expected to occur again in the foreseeable future • Much judgment required to determine if an event is an extraordinary item
Reporting Taxes • Income taxes shown as separate line item • Last item before income from continuing operations • Does not include tax expense/savings from extraordinary items or discontinued operations
Horizontal Analysis • Evaluating financial statements across time • Express change in a financial statement item in percentages instead of dollars Current year amount – Base year amount Base year amount • Reported as a percentage • Two ways to compute • Choose a single year as base period for all years analyzed • Use the prior year as base period
Horizontal Analysis • Compute the change in accounts receivable using • 2010 as the base year • The prior year as the base year
Vertical Analysis • Compares items w/in single fin stmt • All items expressed as a percent of a common amount • Also called common-sizing financial statements • Income statement items • Percent of sales • Balance sheet • Percent of total assets
A Review of All Ratios • Liquidity ratios • Measure ability to pay current bills and operating costs • Solvency ratios • Measure ability to meet long-term obligations and survive over long term • Profitability ratios • Measure operating or income performance • Market indicators • Ratios relating current market price of stock to earnings or dividends
Current Ratio Current Assets _ Current Liabilities • Measure ability to pay current liabilities with current assets • Helps creditors determine if a company can meet its short-term obligations
Quick Ratio Cash + s-t investments + A/R net Current liabilities • Measure ability to meet short-term obligations • Similar to the current ratio • Stricter test because it limits numerator to only very liquid assets
Working Capital Current assets – Current liabilities • Measure ability to meet short-term obligations • Not a ratio • Often measured as part of financial statement analysis
Inventory Turnover Ratio Cost of goods sold _ Average current liabilities • Measure how quickly a company is selling its inventory
Accounts Receivable Turnover Ratio Net credit sales _ Average net accounts receivable • Measure ability to collect the cash from its credit customers
Current Cash Debt Coverage Ratio Net cash from operating activities Average current liabilities • Measure ability to generate cash needed to pay current liabilities from company’s operations
Debt to Equity Ratio Total liabilities _ Total shareholders’ equity • Compare amount of company’s debt with amount owners have invested in the company
Times Interest Earned Ratio Income from operations_ Interest expense • Compare amount of income earned in an accounting period (before interest) to interest obligation for same period • If net income used in numerator, add back interest expense and taxes
Cash Flow Adequacy Ratio Net cash from operating activities _ Net cash required for investing activities • Cash required for investing activities • Cash paid for capital expenditures and acquisitions minus cash proceeds from disposal of capital assets • Measures the firm’s ability to generate enough cash from operating activities to pay for its capital expenditures
Return on Assets Net income + Interest expense_ Average total assets • Measure success in using assets to earn income for owners and creditors • Those who are financing the business • Interest added back to numerator • Interest part of what has been earned to pay creditors • Net income is return to the owners • Interest expense is return to creditors
Asset Turnover Ratio Net sales _ Average total assets • Measure how efficiently a company uses its assets
Return on Equity Net income – preferred dividends _ Average common shareholders’ equity • Measure how much income is earned with the common shareholders’ investment in the company
Gross Profit Ratio Gross profit_ Net sales • Describes percentage of sales price that is gross profit • Carefully watched by management • A small shift usually indicates a big change in the profitability of the company’s sales
Profit Margin Ratio Net income_ Net sales • Measure percentage of each sales dollar that results in net income
Earnings Per Share Net income – preferred dividends_ Weighted average # of shares of common stock outstanding • Calculate net income per share of common stock
Price-earnings Ratio Market price per common share_ Earnings per share • Calculate market price for $1 of earnings • Investors and analysts believe it indicates future earnings potential
Dividend Yield Ratio Dividends per share _ Market price per share • Calculate percentage return on investment in a share of stock via dividends
Understanding Ratio Analysis • Ratios must be compared with something to be useful • Same company for prior periods • Other companies for same period • Industry average for same period
It’s More than Just the Numbers • Information found in notes to financial statements • Inventory cost flow methods • Depreciation methods • How various items are valued • Description of accounting policies
Business Risk, Control, and Ethics • Investor perspective • How do you minimize the risks of stock ownership? • Consult with a financial professional • Diversify your investments • What kinds of investments would make up a diversified portfolio? • Can you eliminate all investment risk?
Assign #9: pg. 644 - #E12-1A, #E12-2A Assign #10: pg. 655-656 - #P12-4A, #P12-5A


![Lsis [Discontinued] iS5| Instronline](https://cdn4.slideserve.com/8115532/variable-frequency-drive-inverter-starvert-dt.jpg)