Download
1 / 54
540 likes | 608 Views
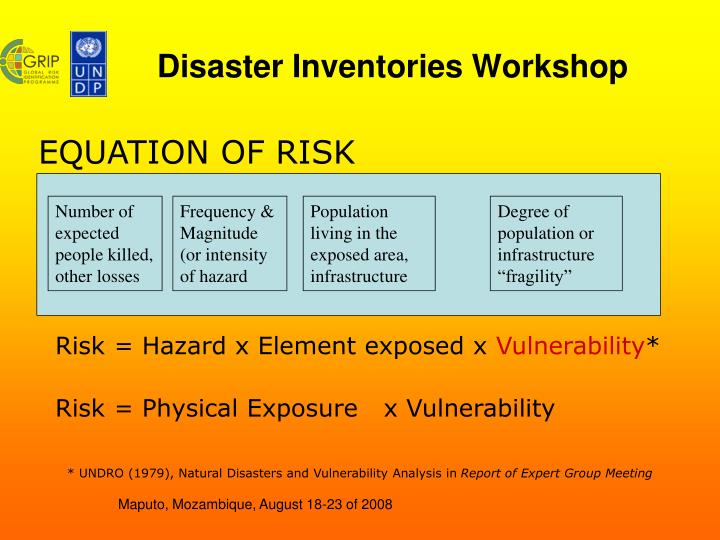
Disaster Inventories Workshop. EQUATION OF RISK. Number of expected people killed, other losses. Frequency & Magnitude (or intensity of hazard. Population living in the exposed area, infrastructure. Degree of population or infrastructure “fragility”.

E N D
Disaster Inventories Workshop EQUATION OF RISK Number of expected people killed, other losses Frequency & Magnitude (or intensity of hazard Population living in the exposed area, infrastructure Degree of population or infrastructure “fragility” Risk = Hazard x Element exposed x Vulnerability* Risk = Physical Exposure x Vulnerability * UNDRO (1979), Natural Disasters and Vulnerability Analysis in Report of Expert Group Meeting Maputo, Mozambique, August 18-23 of 2008
Hazard RISK Vulnerability Exposure Disaster Inventories Workshop The Risk Triangle: Risk is a combination of the interaction of hazard, exposure, and vulnerability, which can be represented by the three sides of a triangle. Reliable & Accurate Data Reliable & Accurate Data If any one of these sides increases, the area of the triangle increases, hence the amount of risk also increases. If any one of the sides reduces, the risk reduces. If we can eliminate one side there is no risk. Reliable & Accurate Data Maputo, Mozambique, August 18-23 of 2008
Disaster Inventories Workshop • Hazard: a natural or social-technological phenomena that produces damages to human lives, economic/social infrastructure and environment (earthquakes, floods, droughts, etc.) • Vulnerability: Degree of population or infrastructure “fragility” to hazards. • Risk: the probability of a certain level of loss to occur. Maputo, Mozambique, August 18-23 of 2008
Disaster Inventories Workshop DISASTER RISK MANAGEMENT CYCLE Maputo, Mozambique, August 18-23 of 2008
Disaster Inventories Workshop Prevention, Preparedness, Mitigation, Risk Reduction…. “Effective early warning and preparedness, land use planning and appropriate construction, risk assessment in projects and planning, community based risk management, insurance (financial and social) and asset protection through social safety nets among others dramatically reduce human exposure to hazard and susceptibility to harm. Action to reduce risks from natural disasters must be at the centre of development policy” DFID Policy Briefing, Disaster risk reduction: a development concern, 2004. Maputo, Mozambique, August 18-23 of 2008
Disaster Inventories Workshop • Emergency: “The phase immediately after impact is characterized by the intense and serious disturbance […] and the minimum conditions necessary for the survival and functioning of the affected social unit are not satisfied • Recovery: Process of re-establishing acceptable and sustainable living conditions through the rehabilitation, repair and reconstruction of destroyed, interrupted or deteriorated infrastructure, goods and services and the reactivation or promotion of economic and social development in affected areas Maputo, Mozambique, August 18-23 of 2008
Disaster Inventories Workshop • UNDAC: mainly for response purposes(United Nations Disaster Assessment and Coordination). Being replaced by a series of more specialized assessments (UNOSAT, EC-IRA, WHO-RHA, etc.) • ECLAC: adopted for measuring direct and indirect economic and social impacts, divided by economical sectors(Economic Commission for Latin America and the Caribbean) Maputo, Mozambique, August 18-23 of 2008
Disaster Inventories Workshop RISK ASSESSMENTS • Are targeted to specific hazards • Require large amounts of information • Involve complex modeling • May change over time • Urban or regional “Risk assessment is the determination of quantitative or qualitative value of risk related to a concrete situation, location and a specific threat.” Maputo, Mozambique, August 18-23 of 2008
Disaster Inventories Workshop Hazard probability (frequency) Exposed population Simple Risk Index Maputo, Mozambique, August 18-23 of 2008
Disaster Inventories Workshop • Identification of Priority areas (Hotspots) • Evaluation of urgency of action • Support for Preparedness, Risk Mitigation, EWS plans • Support for Policies/Regulations and investments • Strategic advantage for negotiation • Other applications Some Applications of Risk Assessments Maputo, Mozambique, August 18-23 of 2008
Disaster Inventories Workshop Maputo, Mozambique, August 18-23 of 2008
DesInventar: The Project • Some of the Hypothesis that inspired the project • Disasters are a problem of Development • Natural disasters are not so “natural” • Impact of Disasters is growing • Small and medium disasters impact is extremely high • Small and medium disasters occurrence patterns can show vulnerability Maputo, Mozambique, August 18-23 of 2008
What is DesInventar • A data collection methodology • A preliminary analysis methodology • A set of Software Tools DesInventar Contexts • As a Historical Disaster database • As a Post-disaster damage & loss data collection tool Maputo, Mozambique, August 18-23 of 2008
DesInventar Methodology: … essentially proposes the collection of homogeneous data about disasters of all scales. The information compiled and processed is entered in a scale of time and referenced to a relatively small geographic unit. Maputo, Mozambique, August 18-23 of 2008
DesInventar Data CollectionMethodology: • Concepts • Definitions • Glossary of Events and Effects • Recommendations & How to’s Maputo, Mozambique, August 18-23 of 2008
DesInventar Methodology: Concepts: Hazard Vulnerability Risk Geography Maputo, Mozambique, August 18-23 of 2008
DesInventar Methodology: Definition: “Event” is defined as any social-natural phenomena that can be considered as a threat to life, properties, infrastructure and environment. Maputo, Mozambique, August 18-23 of 2008
DesInventar Methodology: Definition: “Disaster” is defined as the set of adverse effects caused by social-natural and natural phenomena on human life, properties, infrastructure and environment (an “Event”) within a specific geographic unit during a given period of time. Maputo, Mozambique, August 18-23 of 2008
DesInventar Methodology: • Geography: • multi-layered area units • Hierarchical structure (currently limited to three levels) • Usually Administrative boundaries • Challenge: Selecting the maximum resolution Maputo, Mozambique, August 18-23 of 2008
DesInventar Methodology: GLOSARY OF TERMS: EVENTS Maputo, Mozambique, August 18-23 of 2008
DesInventar Methodology: DEFINITIONS OF EFFECTS Maputo, Mozambique, August 18-23 of 2008
DesInventar Methodology: • Recommendations & How to’s: • Selection of Boundaries • Choosing the maximum resolution • Selecting Codes (and names) • The Period of the research • Selection of sources Maputo, Mozambique, August 18-23 of 2008
DesInventar Methodology: • Recommendations & How to’s: • When disaggregated data is unavailable • Discrepancies among sources • “Chained” events • When geographical units are split • Long duration events Maputo, Mozambique, August 18-23 of 2008
Preliminary Analysis Methodology: • Preliminary analysis is a set of SIMPLE operations that can be routinely applied to a DesInventar database that can provide very quickly with proxy indicators of Risk and help identifying patterns and trends. • Is called “Preliminary” because it doesn’t correlate the data with other possible sources of data such as demography, topography, land use, etc. It is a “self-contained” analysis. • Deeper analysis should be done after to further prove conclusions and establish causes. Maputo, Mozambique, August 18-23 of 2008
Preliminary Analysis Methodology: • Composition of disasters(type and effects) • Temporal analysis(trends and patterns) • Spatial distribution analysis(spatial patterns) • Cause-effect analysis • Statistical Analysis(mean, max, deviation, variance) Maputo, Mozambique, August 18-23 of 2008
Preliminary Analysis Methodology: Composition Analysis: • Shows what types of disasters are affecting a region • Compares the effect of different types of events • Analysis is done on specific types of effects (human life, housing, agriculture, etc.) • Can be done for the entire area or specific sub-regions Maputo, Mozambique, August 18-23 of 2008
Preliminary Analysis Methodology: Use of Composition Analysis: • Provides initial figures aggregated in time and space showing the total impact of disasters. • Helps focusing the rest of the analysis by identifying critical types of events Maputo, Mozambique, August 18-23 of 2008
Examples of Preliminary Analysis With Tamil Nadu Disaster Data • Kanyakumari District Composition of Disasters: Number of Reports Maputo, Mozambique, August 18-23 of 2008
Examples of Preliminary Analysis With Tamil Nadu Disaster Data • Kanyakumari District Composition of Disasters: Number of Deaths Maputo, Mozambique, August 18-23 of 2008
Examples of Preliminary Analysis With Tamil Nadu Disaster Data • Kanyakumari District Composition of Disasters: Number of houses damaged or destroyed Maputo, Mozambique, August 18-23 of 2008
Examples of Preliminary Analysis With Tamil Nadu Disaster Data • State level figures (incomplete) Composition of Disasters: Number of Reports Maputo, Mozambique, August 18-23 of 2008
Examples of Preliminary Analysis With Tamil Nadu Disaster Data • State level figures (incomplete) Composition of Disasters: Number of Deaths Maputo, Mozambique, August 18-23 of 2008
Examples of Preliminary Analysis With Tamil Nadu Disaster Data • State level figures (incomplete) Composition of Disasters: Number of Houses Damaged or Destroyed Maputo, Mozambique, August 18-23 of 2008
Examples of Preliminary Analysis With Tamil Nadu Disaster Data Temporal Analysis: This type of analysis shows patterns of occurrence of disasters along time (for example the seasonality of atmospheric events) and trends of the occurrence and impact of disasters, calculated in terms of different effect variables, such as Number of deaths, Number of destroyed houses, number of reports etc. Maputo, Mozambique, August 18-23 of 2008
Examples of Preliminary Analysis With Tamil Nadu Disaster Data Use of Temporal Analysis: • Provides input for time aspects of contingency plans, DRM, etc. • Follow up of effectiveness of Risk Mitigation Plans Maputo, Mozambique, August 18-23 of 2008
Examples of Preliminary Analysis With Tamil Nadu Disaster Data • Kanyakumari District Occurrence of Disasters: Number of Reports Maputo, Mozambique, August 18-23 of 2008
Examples of Preliminary Analysis With Tamil Nadu Disaster Data • Kanyakumari District Seasonality of Disasters: Number of Deaths Maputo, Mozambique, August 18-23 of 2008
Examples of Preliminary Analysis With Tamil Nadu Disaster Data State level figures (incomplete) Occurrence of Disasters: Number of Reports Maputo, Mozambique, August 18-23 of 2008
Examples of Preliminary Analysis With Tamil Nadu Disaster Data State level figures (incomplete) Trends in Disasters: Number of Deaths EXCLUDING TSUNAMI Maputo, Mozambique, August 18-23 of 2008
Examples of Preliminary Analysis With Tamil Nadu Disaster Data Spatial Analysis: This type of analysis shows patterns of occurrence of disasters over space, displayed as colored areas in terms of the number of reports and different effect variables, such as Number of deaths, Number of destroyed houses, etc. Maputo, Mozambique, August 18-23 of 2008
Examples of Preliminary Analysis With Tamil Nadu Disaster Data Spatial Analysis: • Riskier and/or Vulnerable areas may be identified by isolated areas or clusters of areas with higher than average level of impact • It usually shows patterns of higher than average impact associated to geography elements (rivers, hill areas, etc) • Can be combined with temporary analysis to provide seasonal occurrence maps Maputo, Mozambique, August 18-23 of 2008
Examples of Preliminary Analysis With Tamil Nadu Disaster Data Use of Spatial Analysis: • Provides Maps of proxy indicators of Risk (“proxy risk maps”) in absence of much higher cost, long term risk maps • Should be used as input layer to modelled risk maps • Can be used to validate and complement risk maps • DOES NOT REPLACE OTHER MODELLING-BASED RISK ASSESMENT MAPS or GIS SYSTEMS Maputo, Mozambique, August 18-23 of 2008
Examples of Preliminary Analysis With Tamil Nadu Disaster Data • Kanyakumari District Maputo, Mozambique, August 18-23 of 2008
Examples of Preliminary Analysis With Tamil Nadu Disaster Data • State level figures (Incomplete) Patterns in Disasters: Multi- Hazard Map of Number of Deaths EXCLUDING TSUNAMI Maputo, Mozambique, August 18-23 of 2008
Examples of Preliminary Analysis With Tamil Nadu Disaster Data • State level figures (Incomplete) Patterns in Disasters: Multi-hazard Map of Number of ReportsEXCLUDING TSUNAMI Maputo, Mozambique, August 18-23 of 2008
Examples of Preliminary Analysis With Tamil Nadu Disaster Data • State level figures (Incomplete) Patterns in Disasters: Multi-Hazard Map of Number of Houses affectedEXCLUDING TSUNAMI Maputo, Mozambique, August 18-23 of 2008
Examples of Preliminary Analysis With Tamil Nadu Disaster Data • State level figures (Incomplete) Patterns in Disasters: FLOODS Number of Reports Maputo, Mozambique, August 18-23 of 2008
Examples of Preliminary Analysis With Tamil Nadu Disaster Data • State level figures (Incomplete) Patterns in Disasters: FLOODS Number of Houses affected Maputo, Mozambique, August 18-23 of 2008
Examples of Preliminary Analysis With Tamil Nadu Disaster Data • State level figures (Incomplete) Patterns in Disasters: FLOODS Number of deaths Maputo, Mozambique, August 18-23 of 2008
Examples of Preliminary Analysis With Tamil Nadu Disaster Data Statistical Analysis: • Provides Tabular form of data to support other types of analysis • Provides aggregates of data by multiple criteria with simple pivoting operations • Provides basic statistical measures (mean, variance, std. deviation, maximums, etc) • Provides information to be further processed by other systems (export of aggregated data) Maputo, Mozambique, August 18-23 of 2008