Download
1 / 25
280 likes | 466 Views
Assessing Business Performance. Chapter 6. Structure of Balance Sheet. Page 127. Structure of Balance Sheet. Page 127. Structure of Balance Sheet. Balancing entry. Page 127. Analysis of Balance Sheet. Liquidity: Ability of the firm to convert its current assets to cash and retire

E N D
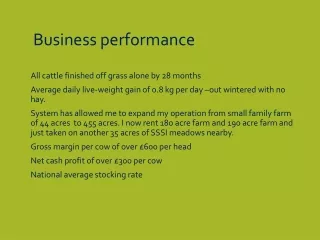
AssessingBusiness Performance Chapter 6
Structure of Balance Sheet Page 127
Structure of Balance Sheet Page 127
Structure of Balance Sheet Balancing entry Page 127
Analysis of Balance Sheet Liquidity: Ability of the firm to convert its currentassets to cash and retire all its currentliabilities. The current ratio is a common measure of liquidity. Current ratio = current assets ÷ current liabilities = $100 ÷ $75 = 1.33 Greater than 1.0 Page 127
Analysis of Balance Sheet Liquidity: Ability of the firm to convert its currentassets to cash and retire all its currentliabilities. The current ratio is a common measure of liquidity. Current ratio = current assets ÷ current liabilities = $100 ÷ $75 = 1.33 Solvency: Ability of the firm to convert its total assets to cash and retire retire all its liabilities. The solvency ratio is a common measure of solvency. Solvency ratio = total assets ÷ total liabilities = $600 ÷ $275 = 2.18 Greater than 1.0 Greater than 1.0 Page 127
Structure of Income Statement Page 129
Structure of Income Statement Page 129
Structure of Income Statement $125 – $75 = $50 Page 129
Structure of Income Statement $125 – $75 = $50 Page 129
Structure of Income Statement $125 – $75 = $50 Page 129
Structure of Income Statement Page 129
Structure of Income Statement 20% tax rate… Page 129
Structure of Income Statement Page 129
Structure of Income Statement The bottom line… Page 129
Analysis of Income Statement Profitability: Two measures of profitability are net income appearing on the Bottom of the income statement and the rate of return on equity or ROE. This latter measure is defined as follows: ROE = net income ÷ equity = $40 ÷ $325 = 0.123 or 12.3% Greater than zero Page 129
Analysis of Income Statement Profitability: Two measures of profitability are net income appearing on the Bottom of the income statement and the rate of return on equity or ROE. This latter measure is defined as follows: ROE = net income ÷ equity = $40 ÷ $325 = 0.123 or 12.3% Efficiency: A measure of economic efficiency is the gross ratio which indicates The expenses per dollar of revenue. This measure is found by: Gross ratio = total expenses ÷ total revenue = $75 ÷ $125 = 0.60 Greater than zero Pre-tax profit margin is 40% Page 129
Accountant Vs. Economist Accounting profit: Limited to a measure of explicit costs appearing on the business’s income statement. Accounting profit = total revenue – total cost = $125 - $75 = $50 Page 136
Accountant Vs. Economist Accounting profit: Limited to a measure of explicit costs appearing on the business’s income statement. Accounting profit = total revenue – total cost = $125 - $75 = $50 Economic profit: Includes measure of implicit costs, which is an opportunity cost a business charges itself for using its existing resources that does not involve a payment of money. Economic profit = total revenue – total cost – implicit cost Page 136
Use of Financial Statements • Historical analysis of performance over time • Comparative analysis of performance with similar firms • Pro forma analysis • Internal uses (e.g., investment decisions • External uses (e.g., credit decisions
What Lies Ahead? • What products should be produced, and how much should be produced? • What level of specific inputs will be needed to produce these products? • How should the acquisition of these inputs be financed? • How large should the business become? Page 138
Problem 4 on Page 140 Given the following values, calculate the firm’s liquidity Solvency and profitability: Current assets $100 Other assets 500 Current liabilities 75 Total liabilities 275 Variable expenses 50 Provision for taxes 10 Total expenses 75 Total revenue 125
Problem 4 on Page 140 Given the following values, calculate the firm’s liquidity Solvency and profitability: Current assets $100 Other assets 500 Current liabilities 75 Total liabilities 275 Variable expenses 50 Provision for taxes 10 Total expenses 75 Total revenue 125 Current ratio = 100 ÷ 75 = 1.33 so the firm is liquid….
Problem 4 on Page 140 Given the following values, calculate the firm’s liquidity Solvency and profitability: Current assets $100 Other assets 500 Current liabilities 75 Total liabilities 275 Variable expenses 50 Provision for taxes 10 Total expenses 75 Total revenue 125 Total assets = 100+500 = $600 Total liabilities = $275 Solvency ratio = 600 ÷ 275 = 2.18 so the firm is solvent….
Problem 4 on Page 140 Given the following values, calculate the firm’s liquidity Solvency and profitability: Current assets $100 Other assets 500 Current liabilities 75 Total liabilities 275 Variable expenses 50 Provision for taxes 10 Total expenses 75 Total revenue 125 Net income = 125 – 75 – 10 = $40 Total assets = $600 Total liabilities = $275 Total equity = 600 – 275 = $325 ROE = 40 ÷ 325 = .123 or 12.3% so the firm is profitable….