Download
1 / 4
40 likes | 148 Views
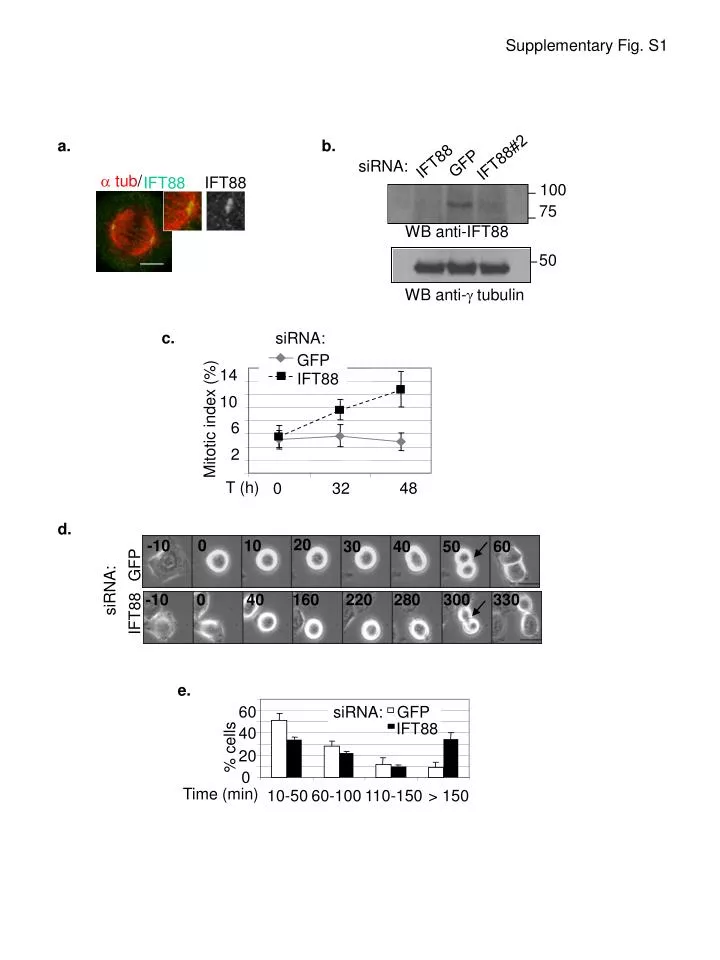
Supplement ary Fig. S 1. a. b. IFT88#2. IFT88. GFP. siRNA:. a tub /. IFT88. IFT88. 100. 75. WB anti- IFT88. 50. WB anti- g tubulin. c. siRNA:. GFP. 14. IFT88. 10. Mitotic index (%). 6. 2. T (h). 48. 0. 3 2. d. 20. 0. -10. 10. 30. 40. 50. 60. GFP. siRNA:.

E N D
Supplementary Fig. S1 a. b. IFT88#2 IFT88 GFP siRNA: a tub/ IFT88 IFT88 100 75 WB anti-IFT88 50 WB anti-g tubulin c. siRNA: GFP 14 IFT88 10 Mitotic index (%) 6 2 T (h) 48 0 32 d. 20 0 -10 10 30 40 50 60 GFP siRNA: -10 0 40 160 220 280 300 330 IFT88 e. 60 siRNA: GFP IFT88 40 % cells 20 0 Time (min) 10-50 60-100 110-150 > 150
Phos-H3 positive cells (Fold increase) 3 2 1 0 siRNA: MO: Con IFT88 control IFT88sc Supplementary Fig. S2 a. b. 90 siRNA: IFT88sc Control 70 72h 48h 72h 32h 48h 32h 100 50 % cells 75 30 WB anti-IFT88 75 10 Disrupted poles Disrupted g tubulin Misaligned chrom Spindle tilt WB anti-dynein IFT88sc siRNA: c. 40 control 30 IFT88sc 20 % cells w/ spindle defects GFP / a tubulin 10 0 GFP neg GFP pos GFP-IFT88 / LLC-PK1 d. a tubulin / g tubulin 100 Tg737 +/+ 80 Tg737 +/+ Tg737 -/- 60 % cells 40 20 0 Tg737 -/- 0 10 5 20 Spindle angle (a °) a tubulin/ g tubulin/ Phos-H3 e. Control MO IFT88 MO
16 12 g tubulin intensity (x105 a.u.) 8 4 0 siRNA: IFT88 GFP Supplementary Fig. S3 a. b. siRNA: IFT88 siRNA: GFP EB1 EB1 14000 14000 Gray scale 12000 Gray scale 12000 10000 10000 60000 60000 5051 5051 35000 35000 Gray scale Gray scale 10000 10000 0 10 20 0 10 20 Distance (mm) Distance (mm) c. d. IFT88/ EB1/ EB1 IFT88 DAPI 70 GFP 50 MT nucleation rate (min-1) siRNA: 30 10 EB1 siRNA: GFP IFT88
Supplementary Fig. S4 a tub Dyn IC a tub/ Dyn a. a tub a tub/ Dyn Dyn IC a tub IgG a tub/ IgG a tub/ IgG IgG a tub Negative controls a tub/ a tub/ a tub No primary No primary a tub No primary No primary b. c. Mitotic shake off Mitotic shake off IP: Con Dyn IC Input IP: Con IFT88 Input 100 100 75 WB anti-IFT88 WB anti-IFT88 75 75 WB anti-Dynein IC WB anti-Dynein IC Mitotic shake off: Input IP Flag IP Ig d. IMCD IMCD Flag-IFT52 + - + - - - + - + + 100 IFT88 WB anti-IFT88 75 Flag-IFT52 WB anti-Flag 50 e. IP Ig IP IFT88 Input Mitotic shake off: IMCD IMCD Flag-IFT52 + - + - - + - + + - - + 100 IFT88 75 WB anti-IFT88 Flag-IFT52 50 WB anti-Flag