Download
1 / 24
240 likes | 387 Views
NWEA 2011 - RIT Scale Norms. Some Things You Should Know About the 2011 RIT Scale Norms Prepared by: Dan Henderson, NWEA Partner Relations Region Manager John Woodin, NWEA Partner Relations State Representative. Introduction. “No, your students’ performance didn’t change from last spring.”

E N D
NWEA 2011 - RIT Scale Norms Some Things You Should Know About the 2011 RIT Scale Norms Prepared by: Dan Henderson, NWEA Partner Relations Region Manager John Woodin, NWEA Partner Relations State Representative
Introduction • “No, your students’ performance didn’t change from last spring.” • The norm group and methodology did change • Simply creates a different comparison • A 215 RIT is still a 215 RIT – means the same thing related to performance
Key Differences from 2008 • Methodology: set of norms more representative of school age population • Everyone will see some changes: status and growth norms • Norms have been applied to both past and current scores (for consistency and growth projections)
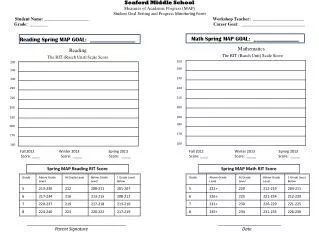
What will be “fixed” in the 2011 Norms… • Asterisks * will be replaced with 1 or 99 (percentiles) • Kindergarten growth norms will be reinstated for fall to spring • Kindergarten status norms will be reinstated for fall and winter • 11th grade norms will be reinstated as soon as possible
Sampling student test records • “Students” were randomly sampled from a pool of test event records. (all test records of the student from the study period in the subject of interest) • Pool represented about 5.1 million students, • from 13,000 schools • located in more than 2,700 school districts • from over 50 states and • contained about 35 million test events. • Smallest grade level sample was about 20,000 students.
Post-stratification procedures • Based on school-level variables commonly associated with challenges and opportunities • School–level variables: Mix of student ethnicity, percent free/reduced lunch eligibility, Title 1 eligibility, ALL Title 1, grade range served, charter status, magnet status, enrollment at each grade, total enrollment, school level, school type, school locale, pupil-teacher ratio. • Combined to form a School Challenge Index (SCI) for each state – using ALL schools in the state, not only NWEA schools • SCI was used as a post-stratification weight for all analyses
Differences in Status Norms • Minor changes in status norms • Percentiles changed very little • Larger changes for grades 1 & 2 for high and low achieving students • Difference in partner base (more schools and students than 2008) • Different methodology for selection which results in more representative norms
Difference in Growth Norms • Less difference in the middle of achievement continuum • Larger differences at the two ends of achievement (especially extremes) • High or low achievers may see larger differences in growth projections • Low Achievers: lower grow projections than in the past • High Achievers: higher growth projections
Growth in 2008 Norm study Pt. A FALL Pt. B Spring Growth within the grade only
* How growth is conceptualized Instructional weeks 54 72 82 36 1 students 1 2 All scores included 3 4 . 5 . 6 . All scores included
Flat Growth Rates • Growth projections tend to be flatter in 2011 than the 2008 norms • Grades 5, 6, 8 show flat growth in Math • In a large national sample, students in these grades tended to show similar growth regardless of where they were on the RIT scale • Due to sampling methods – overly large impact of extreme scores in 2008
Applying Growth to Past Terms • Since NWEA uses growth norms that overlap from year to year – had to apply the norms backward • Cannot compare 2008 growth norms to 2011 growth norms – not comparable