Download
1 / 31
310 likes | 404 Views
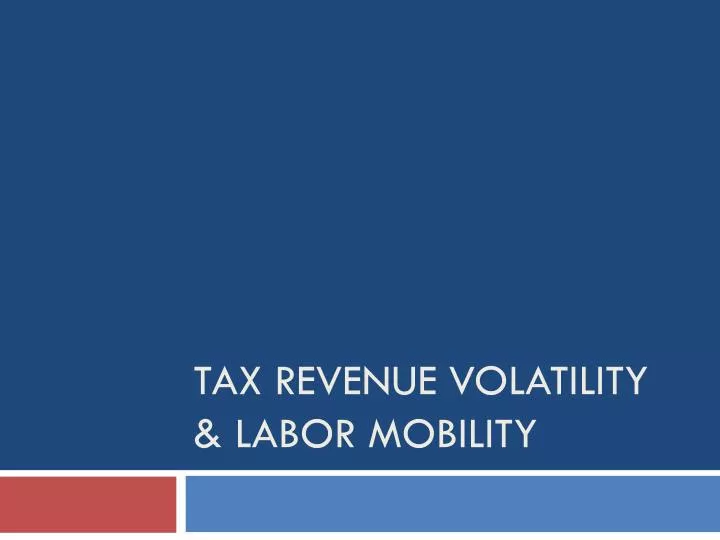
Tax Revenue Volatility & Labor Mobility. Volatility of Tax Revenues. Why should we care about the volatility of our state tax revenues? Our livelihood as a state depends on having revenues to fund state activities Investment/Planning Competition Solvency. Data Analysis.

E N D
Volatility of Tax Revenues • Why should we care about the volatility of our state tax revenues? • Our livelihood as a state depends on having revenues to fund state activities • Investment/Planning • Competition • Solvency
Data Analysis • Want to see what factors contribute to volatility in tax revenues and then see how Louisiana fits into the big picture • We analyzed data on per capita state tax revenue collections from 1993-2007 • Data is from the US Census Bureau • Tax collections are adjusted for inflation
Determinants of Volatility • Why does Louisiana have such volatile state tax revenues? What determines a state’s volatility? • Tax Structure • Dependence on specific types of taxes may contribute to volatility • Severance Taxes, Property Taxes • Sales Taxes, Income Taxes, Corporate Income Taxes
Determinants of Volatility Cont’d • Income • States with higher incomes will likely have higher volatility • Income Distribution • States with more unequal distributions of income will likely have more volatility • Size • Larger states will likely have lower volatility
Tax Structure & Volatility • Using data on state tax collections for all 50 states we estimated the relationship between volatility and the dependence of each state’s revenues on particular taxes • Elasticity = by what percentage does volatility increase/decrease when the dependence on a particular type of tax increases by 1%
Elasticity Illustration • Suppose that we estimated the income tax elasticity to be .75. • This would mean that a 1% increase in a state’s dependence on income tax revenue would increase volatility by .75% • Or, a 10% increase in a state’s dependence on income tax revenue would increase volatility by 7.5% • A negative income tax elasticity would indicate that increasing a state’s dependence on income tax revenue lowers volatility
Other Elasticities • We also estimated elasticities with regard to other factors that may affect volatility • Income • Use data on Median Income in each state, from the 2000 American Community Survey • Size • Use population data from the 2000 Census • Income Inequality • This one is a bit more complex
The Gini Coefficient • There is no perfect way to measure income inequality • The Gini Coefficient measures income inequality on a scale from 0 to 1 • Closer to zero means income distribution is more equal • Closer to one means that income distribution is more unequal
Generating the Gini Coefficient Cumulative % of Income Line of Equality 100% 80% 60% 40% Lorenz Curve 20% Cumulative % of Households 20% 40% 60% 80% 100%
Louisiana & Volatility • Positive Factors • Very low dependence on property taxes • Negative Factors • Very high dependence on severance taxes • Very high income inequality • Even Worse Factors • Volatility in Louisiana is far greater than it is estimated to be given its characteristics
Skills and Migration • One vital requirement for growth at the state level is the skill composition and quality of the work force • We will take a look at the skill composition of the Louisiana workforce and examine the skill and quality composition of those migrating in and out of the state
Skill Distribution of LA Net Out-Migration of Working Age Persons
Skill Distribution of LA Net Out-Migration of Core Labor Force
Worker Quality • While education is a good indicator of the skill level of an individual, it is not the only factor that determines the quality of a worker • Some workers have better aptitudes than others which in turn makes them more successful in their line of work • We want to see whether the workers that are coming in and going out of Louisiana are high or low quality workers given their skill characteristics
Quality of Louisiana Working Age Migrants Relative to National Average
Quality of Louisiana Core Labor Force Migrants Relative to National Average
Louisiana and Migration • Louisiana’s population has been shrinking over the past 8 years • Some of that due to Katrina • The decline in population is more heavily skewed toward individuals with higher levels of education • Across all skill groups the average worker we import is of higher quality than the average worker we export