Download
1 / 33
330 likes | 451 Views
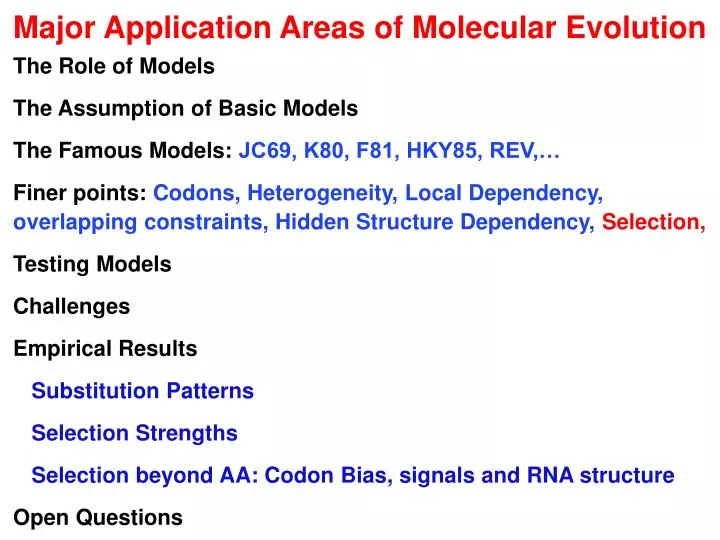
Major Application Areas of Molecular Evolution. The Role of Models The Assumption of Basic Models The Famous Models: JC69, K80, F81, HKY85, REV,… Finer points: Codons, Heterogeneity, Local Dependency, overlapping constraints, Hidden Structure Dependency, Selection, Testing Models

E N D
Major Application Areas of Molecular Evolution The Role of Models The Assumption of Basic Models The Famous Models: JC69, K80, F81, HKY85, REV,… Finer points: Codons, Heterogeneity, Local Dependency, overlapping constraints, Hidden Structure Dependency, Selection, Testing Models Challenges Empirical Results Substitution Patterns Selection Strengths Selection beyond AA: Codon Bias, signals and RNA structure Open Questions
Reality Model Complex Not precise Simpler Precise Models and Reality Deterministic Stochastic Dynamic (time) Time: continuous/discrete Space continuous/discrete • Model identification: Select model that fits reality • Properties and reasoning is all done within models
Principle of Inference: Likelihood Likelihood function L() – the probability of data as function of parameters: L(Q,D) LogLikelihood Function – l(): ln(L(Q,D)) If the data is a series of independent experiments L() will become a product of Likelihoods of each experiment, l() will become the sum of LogLikelihoods of each experiment In Likelihood analysis parameter is not viewed as a random variable.
Bayesian Inference In Bayesian analysis parameter is viewed as a random variable. • Prior distribution. In previous example the parameter p would have to be given a distribution for instance uniform on [0.0-1.0]. • After observing the data a posterior distribution given the data is defined. • Inference is different between likelihood and Bayesian analysis, but many modeling aspects are common. • Computionally: Bayesian analysis involves integration over parameter space, while likelihood analysis is local analysis around maximum likelihood estimate
The Purpose of Stochastic Models. • Molecular Evolution is Stochastic. 2. To estimate evolutionary parameters, not observable directly: i. Real number of events in evolutionary history. ii. Rates of different kinds of events in evolutionary history. iii. Strength of selection against amino acid changing nucleotide substitutions. iv. Estimate importance of different biological factors. • Survive a goodness of fit test. 4. Serve these purposes as simply as possible. Comment: knowledge might be preclude models
ACGCC ACGCC AGGCC AGGCC AGGCT AGGCT AGGGC AGGCT AGGCT AGGTT AGGTT AGTGC Central Problems: History cannot be observed, only end products. ACGTC ACGTC Even if History could be observed, the underlying process couldn’t !!
Simplifying Assumptions I Probability of Data Biological setup TCGGTA TGGTT a - unknown 1) Only substitutions. s1 TCGGTA s1 TCGGA s2 TGGT-T s2 TGGTT a5 a4 a3 a2 a1 T A T G G G G C T T Data: s1=TCGGTA,s2=TGGTT 2) Processes in different positions of the molecule are independent, so the probability for the whole alignment will be the product of the probabilities of the individual patterns.
Simplifying Assumptions II a l2+l1 l1 = l2 N1 N2 N2 N1 3) The evolutionary process is the same in all positions 4) Time reversibility: Virtually all models of sequence evolution are time reversible. I.e. πi Pi,j(t) = πj Pj,i(t), where πi is the stationary distribution of i and Pt(i->j) the probability that state i has changed into state j after t time. This implies that
Simplifying assumptions III t1 e A t2 C C 5) The nucleotide at any position evolves following a continuous time Markov Chain. Pi,j(t) continuous time markov chain on the state space {A,C,G,T}. Q - rate matrix: T O A C G T FA -(qA,C+qA,G+qA,T) qA,C qA,G qA,T RC qC,A -(qC,A+qC,G+qC,T) qC, G qC ,T OG qG,A qG,C -(qG,A+qG,C+qG,T) qG,T MT qT,A qT,C qT,G -(qT,A+qT,C+qT,G) 6) The rate matrix, Q, for the continuous time Markov Chain is the same at all times (and often all positions). However, it is possible to let the rate of events, ri, vary from site to site, then the term for passed time, t, will be substituted by ri*t.
Q and P(t) What is the probability of going from i (C?) to j (G?) in time t with rate matrix Q? i. P(0) = I ii. P(e) close to I+eQ for e small iii. P'(0) = Q. iv. lim P(t) has the equilibrium frequencies of the 4 nucleotides in each row v. Waiting time in state j, Tj, P(Tj > t) = e -(qjjt) vi. QE=0Eij=1 (all i,j) vii. PE=E viii. If AB=BA, then eA+B=eAeB.
Jukes-Cantor 69: Total Symmetry Rate-matrix, R: T O A C G T F A -3*aa aa R C a -3*aaa O G a a -3* a a M T a a a -3* a Transition prob. after time t, a = a*t: P(equal) = ¼(1 + 3e-4*a ) ~ 1 - 3a P(diff.) = ¼(1 - 3e-4*a ) ~ 3a Stationary Distribution: (1,1,1,1)/4.
Kimura 2-parameter model TO A C G T F A -2*b-a b a b R Cb -2*b-a b a O Ga b -2*b-a b M Tb a b -2*b-a a = a*t b = b*t Q: start P(t):
Felsenstein81 & Hasegawa, Kishino & Yano 85 Unequal base composition: (Felsenstein, 1981) Qi,j = C*πj i unequal j Transition/transversion & compostion bias (Hasegawa, Kishino & Yano, 1985) (a/b)*C*πj i- >j a transition Qi,j = C*πj i- >j a transversion
General Reversible Model TO A C G T F A - agC bgG cgT R C agA - dgG egT O G bgA dgC - fgT M T cgA egC fgG - • Biased symmetric. • 6 parameters for the upper triangular matrix • 3 parameters for the nucleotide bias
From singlet models to doublet models: Contagious Dependence: Independence Independence with CG avoidance Strand symmetry Only single events Single events with simple double events Pedersen and Jensen, 2001 Siepel and Haussler, 2003 The Data: 100 kb non-coding from chromosomes 22 and 10 from mouse and human. From Lunter & Hein,2004 Basic Dinucleotide model: AB --> CD
Rate variation between sites:iid each site Let L(pi,Q,t) be the likelihood for observing the i'th pattern, t all time lengths, Q the parameters describing the process parameters and f(ri) the continuous distribution of rate(s). Then The rate at each position is drawn independently from a distribution, typically a G (or lognormal) distribution. G(a,b) has density xb-1*e-ax/G(b) , where a is called scale parameter and b form parameter.
positions 1 n 1 sequences k slow - rs HMM: fast - rf Likelihood Recursions: Likelihood Initialisations: Fast/Slowly Evolving States Felsenstein & Churchill, 1996 • pr - equilibrium distribution of hidden states (rates) at first position • pi,j - transition probabilities between hidden states • L(j,r) - likelihood for j’th column given rate r. • L(j,r) - likelihood for first j columns given j’th column has rate r.
Dayhoffs empirical approach (1970) Take a set of closely related proteins, count all differences and make symmetric difference matrix, since time direction cannot be observed. If qij=qji, then equilibrium frequencies, pi, are all the same. The transformation qij --> piqij/pj, then equilibrium frequencies will be pi.
Codon based Models Goldman,Yang + Muse,Gaut • Codons as the basic unit. ii. A codon based matrix would have (61*61)-61 (= 3661) off-diagonal entries. i. Bias in nucleotide usage. ii. Bias in codon usage. iii. Bias in amino acid usage. iv. Synonymous/non-synonymous distinction. v. Amino acid distance. vi. Transition/transversion bias. codon i and codon j differing by one nucleotide (otherwise 0.0), then apj exp(-di,j/V) differs by transition qi,j = bpj exp(-di,j/V) differs by transversion. -di,j is a physico-chemical difference between amino acid i and amino acid j. V is a factor that reflects the variability of the gene involved.
Measuring Selection ThrPro ACGCCA - ThrSer ACGCCG ArgSer AGGCCG - ThrSer ACTCTG AlaSer GCTCTG AlaSer GCACTG ThrSer ACGTCA Certain events have functional consequences and will be selected out. The strength and localization of this selection is of great interest. The selection criteria could in principle be anything, but the selection against amino acid changes is without comparison the most important
i. The Genetic Code 3 classes of sites: 4 2-2 1-1-1-1 4 (3rd) 1-1-1-1 (3rd) ii. TA (2nd) Problems: i. Not all fit into those categories. ii. Change in on site can change the status of another.
Possible events if the genetic code remade from Li,1997 Possible number of substitutions: 61 (codons)*3 (positions)*3 (alternative nucleotides). Substitutions Number Percent Total in all codons 549 100 Synonymous 134 25 Nonsynonymous 415 75 Missense 392 71 Nonsense 23 4
Synonyous (silent) & Non-synonymous (replacement) substitutions Ser Thr Glu Met Cys Leu Met Gly Thr TCA ACT GAG ATG TGT TTA ATG GGG ACG *** * * * * * * ** GGG ACA GGG ATA TAT CTA ATG GGT AGC Ser Thr Gly Ile Tyr Leu Met Gly Ser Ks : Number of Silent Events in Common History Ka : Number of Replacement Events in Common History Ns : Silent positions Na : replacement positions. Rates per pos: ((Ks/Ns)/2T) Example: Ks =100 Ns = 300 T=108 years Silent rate (100/300)/2*108 = 1.66 * 10-9 /year/pos. Thr ACC * Thr ACG Ser AGC Miyata: use most silent path for calculations. * * Arg AGG
Probabilities: Rates: b start b a a b Kimura’s 2 parameter model & Li’s Model. Selection on the 3 kinds of sites (a,b)(?,?) 1-1-1-1 (f*a,f*b) 2-2 (a,f*b) 4 (a, b)
alpha-globin from rabbit and mouse. Ser Thr Glu Met Cys Leu Met Gly Gly TCA ACT GAG ATG TGT TTA ATG GGG GGA * * * * * * * ** TCG ACA GGG ATA TAT CTA ATG GGT ATA Ser Thr Gly Ile Tyr Leu Met Gly Ile Sites Total Conserved Transitions Transversions 1-1-1-1 274 246 (.8978) 12(.0438) 16(.0584) 2-2 77 51 (.6623) 21(.2727) 5(.0649) 4 78 47 (.6026) 16(.2051) 15(.1923) Z(at,bt) = .50[1+exp(-2at) - 2exp(-t(a+b)] transition Y(at,bt) = .25[1-exp(-2bt )] transversion X(at,bt) = .25[1+exp(-2at) + 2exp(-t(a+b)] identity L(observations,a,b,f)= C(429,274,77,78)* {X(a*f,b*f)246*Y(a*f,b*f)12*Z(a*f,b*f)16}* {X(a,b*f)51*Y(a,b*f)21*Z(a,b*f)5}*{X(a,b)47*Y(a,b)16*Z(a,b)15} where a = at and b = bt. Estimated Parameters: a = 0.3003 b = 0.1871 2*b = 0.3742 (a + 2*b) = 0.6745 f = 0.1663 Transitions Transversions 1-1-1-1 a*f = 0.0500 2*b*f = 0.0622 2-2 a = 0.3004 2*b*f = 0.0622 4 a = 0.3004 2*b = 0.3741 Expected number of: replacement substitutions 35.49 synonymous 75.93 Replacement sites : 246 + (0.3742/0.6744)*77 = 314.72 Silent sites : 429 - 314.72 = 114.28 Ks = .6644 Ka = .1127
Extension to Overlapping Regions Hein & Stoevlbaek, 95 1st 1-1-1-1 2-2 4 2nd (f1f2a, f1f2b) (f2a, f1f2b) (f2a, f2b) 1-1-1-1 sites 2-2 4 (f1a, f1f2b) (f2a, f1f2b) (a, f2b) (f1a, f1b) (a, f1b) (a, b) pol gag Example: Gag & Pol from HIV Gag 1-1-1-1 2-2 4 Pol 64 31 34 1-1-1-1 sites 2-2 4 40 7 0 27 2 0 MLE:a=.084 b= .024 a+2b=.133 fgag=.403 fpol=.229 Ziheng Yang has an alternative model to this, were sites are lumped into the same category if they have the same configuration of positions and reading frames.
HIV1 Analysis Hasegawa, Kisino & Yano Subsitution Model Parameters: a*t β*t pApCpGpT 0.350 0.105 0.361 0.181 0.236 0.222 0.015 0.005 0.004 0.003 0.003 Selection Factors GAG 0.385 (s.d. 0.030) POL 0.220 (s.d. 0.017) VIF 0.407 (s.d. 0.035) VPR 0.494 (s.d. 0.044) TAT 1.229 (s.d. 0.104) REV 0.596 (s.d. 0.052) VPU 0.902 (s.d. 0.079) ENV 0.889 (s.d. 0.051) NEF 0.928 (s.d. 0.073) Estimated Distance per Site: 0.194
B. Jukes-Cantor and unknown branch lengths ACGTTGCAA ... l1 L2 = pAAA(l1',l2',l3') #AAA*...*pTTT(l1',l2',l3') #TTT TCGTTTCGA ... l3 l2 AGCTTTTGA ... Statistical Test of Models (Goldman,1990) Data: 3 sequences of length L ACGTTGCAA ... AGCTTTTGA ... TCGTTTCGA ... A. Likelihood (free multinominal model 63 free parameters) L1 = pAAA#AAA*...pAAC#AAC*...*pTTT#TTT where pN1N2N3 = #(N1N2N3)/L Test statistics: I. (expected-observed)2/expected or II: -2 lnQ = 2(lnL1 - lnL2) JC69 Jukes-Cantor: 3 parameters => c2 60 d.of freedom Problems: i. To few observations pr. pattern. ii. Many competing hypothesis. Parametric bootstrap: i. Maximum likelihood to estimate the parameters. ii. Simulate with estimated model. iii. Make simulated distribution of -2 lnQ. iv. Where is real -2 lnQ in this distribution?
History of Phylogenetic Methods & Stochastic Models 1958 Sokal and Michener publishes UGPMA method for making distrance trees with a clock. 1964 Parsimony principle defined, but not advocated by Edwards and Cavalli-Sforza. 1962-65 Zuckerkandl and Pauling introduces the notion of a Molecular Clock. 1967 First large molecular phylogenies by Fitch and Margoliash. 1969 Heuristic method used by Dayhoff to make trees and reconstruct ancetral sequences. 1969 Jukes-Cantor proposes simple model for amino acid evolution. 1970: Neyman analyzes three sequence stochastic model with Jukes-Cantor substitution. 1971-73 Fitch, Hartigan & Sankoff independently comes up with same algorithm reconstructing parsimony ancetral sequences. 1973 Sankoff treats alignment and phylogenies as on general problem – phylogenetic alignment. 1979 Cavender and Felsenstein independently comes up with same evolutionary model where parsimony is inconsistent. Later called the “Felsenstein Zone”. 1979: Kimura introduces transition/transversion bias in nucleotide model in response to pbulication of mitochondria sequences. 1981: Felsenstein Maximum Likelihood Model & Program DNAML (i programpakken PHYLIP). Simple nucleotide model with equilibrium bias.
1981 Parsimony tree problem is shown to be NP-Complete. 1985: Felsenstein introduces bootstrapping as confidence interval on phylogenies. 1985: Hasegawa, Kishino and Yano combines transition/transversion bias with unequal equilibrium frequencies. 1986 Bandelt and Dress introduces split decomposition as a generalization of trees. 1985-: Many authors (Sawyer, Hein, Stephens, M.Smith) tries to address the problem of recombinations in phylogenies. 1991 Gillespie’s book proposes “lumpy” evolution. 1994 Goldman & Yang + Muse & Gaut introduces codon based models 1997-9 Thorne et al., Sanderson & Huelsenbeck introduces the Almost Clock. 2000 Rambaut (and others) makes methods that can find trees with non-contemporaneous leaves. 2000 Complex Context Dependent Models by Jensen & Pedersen. Dinucleotide and overlapping reading frames. 2001- Major rise in the interest in phylogenetic statistical alignment 2001- Comparative genomics underlines the functional importance of molecular evolution.
References: Books & Journals Joseph Felsenstein "Inferring Phylogenies” 660 pages Sinauer 2003 Excellent – focus on methods and conceptual issues. Masatoshi Nei, Sudhir Kumar “Molecular Evolution and Phylogenetics” 336 pages Oxford University Press Inc, USA 2000 R.D.M. Page, E. Holmes “Molecular Evolution: A Phylogenetic Approach” 352 pages 1998 Blackwell Science (UK) Dan Graur, Li Wen-Hsiung “Fundamentals of Molecular Evolution” Sinauer Associates Incorporated 439 pages 1999 Margulis, L and K.V. Schwartz (1998) “Five Kingdoms” 500 pages Freeman A grand illustrated tour of the tree of life Semple, C and M. Steel “Phylogenetics” 2002 230 pages Oxford University Press Very mathematical Yang, Z. (2006) Computational Molecular Evolution OUP Journals Journal of Molecular Evolution : http://www.nslij-genetics.org/j/jme.html Molecular Biology and Evolution : http://mbe.oupjournals.org/ Molecular Phylogenetics and Evolution : http://www.elsevier.com/locate/issn/1055-7903 Systematic Biology - http://systbiol.org/ J. of Classification - http://www.pitt.edu/~csna/joc.html
References: www-pages Tree of Life on the WWW http://tolweb.org/tree/phylogeny.html http://www.treebase.org/treebase/ Software http://evolution.genetics.washington.edu/phylip.html http://paup.csit.fsu.edu/ http://morphbank.ebc.uu.se/mrbayes/ http://evolve.zoo.ox.ac.uk/beast/ http://abacus.gene.ucl.ac.uk/software/paml.html Data & Genome Centres http://www.ncbi.nih.gov/Entrez/ http://www.sanger.ac.uk