Download
1 / 24
240 likes | 338 Views
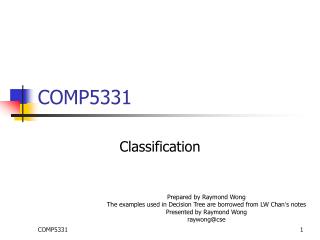
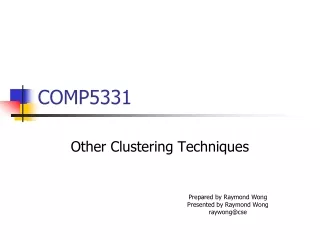
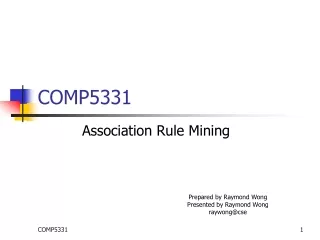
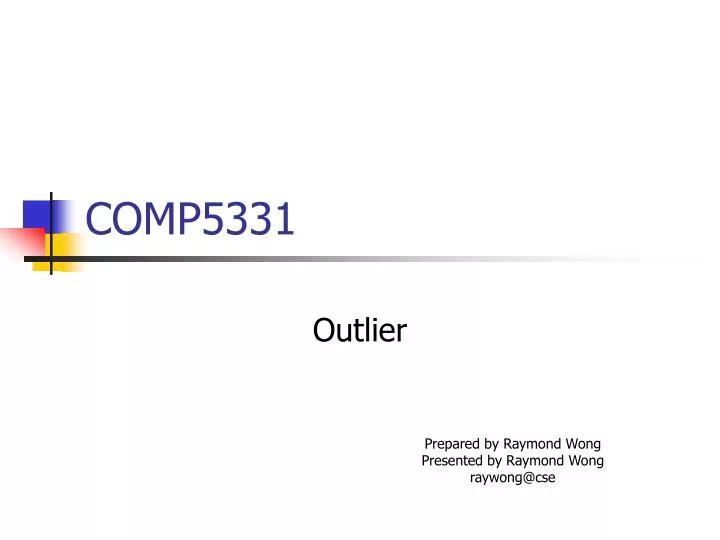
COMP5331. Outlier. Prepared by Raymond Wong Presented by Raymond Wong raywong@cse. History. Computer. Outlier. Cluster 2 (e.g. High Score in History and Low Score in Computer). Clustering:. Outlier (e.g. Low Score in Computer and Low Score in History).

E N D
COMP5331 Outlier Prepared by Raymond Wong Presented by Raymond Wong raywong@cse
History Computer Outlier Cluster 2(e.g. High Score in Historyand Low Score in Computer) Clustering: Outlier (e.g. Low Score in Computer and Low Score in History) Cluster 1(e.g. High Score in Computer and Low Score in History) Outlier (e.g. High Score in Computer and High Score in History) Problem: to find all outliers
Outlier • Applications • Fraud Detection • Detect unusual usage of credit cards or telecommunication services • Medical Analysis • Finding unusual response to various medical treatment • Customized Marketing • Customers with extremely low or extremely high incomes • Network • A potential network attack • Software • A potential bug
Outlier • Statistical Model • Distance-based Model • Density-Based Model
Statistical Model • An outlier is an observation that is numerically distant from the rest of the data • E.g., • Consider 1-dimensional data • How is a data point considered as an outlier?
Statistical Model • Assume the 1-dimensional data follows the normal distribution p(x) P(x > 10000) is a small value or P(x < 5) is a small value Outlier: all values > 10000 or all values < 5 x
Statistical Model • Disadvantage • Assume that the data follows a particular distribution
Outlier • Statistical Model • Distance-based Model • Density-Based Model
Distance-based Model • Advantage • This model does not assume any distribution • Idea • A point p is considered as an outlier if there are too few data points which are close to p
Distance-based Model • Given a point p and a non-negative real number , • the -neighborhood of point p, denoted by N(p), is the set of points q (including point p itself) such that the distance between p and q is within . • Given a non-negative integer No and a non-negative real number • A point p is said to be an outlier if • N(p) <= No
Distance-based Model C2 C1 No = 2 a
Distance-based Model • Is the distance-based model “perfect” to find the outliers?
Distance-based Model C2 C1 b No = 2 a
Outlier • Statistical Model • Distance-based Model • Density-Based Model
Density-Based Model • Advantage: • This model can find some “local” outliers
Density-Based Model • Idea C2 Density is high Density is low C1 b The ratio of these densities is large outlier a
Density-Based Model • Idea C2 Density is high C1 b The ratio of these densities is large outlier a Density is very low
Density-Based Model • Idea C2 Density is high C1 b These densities are “similar” NOT outlier a Density is high
Density-Based Model • Idea C2 Density is high Density is high C1 b These densities are “similar” NOT outlier a
Density-Based Model • Formal definition • Given an integer k and a point p, • Nk(p) is defined to be the -neighborhood of p (excluding point p) • where is the distance between p and the k-th nearest neighbor e d c N1(a) = ? b N2(a) = ? a
Density-Based Model o p • Reachability Distance of p with respect to o • Given two points p and o and an integer k, • Reach_distk(p, o) is defined to be max{dist(p, o), } • where is the distance between p and the k-th nearest neighbor e d Reach_dist2(a, b) =? c k = 2 Reach_dist2(a, c) =? b Reach_dist2(a, d) =? a Reach_dist2(a, e) =?
Density-Based Model Why? • The average reachability distance of p among all k nearest neighbors is equal to • where is the distance between p and the k-th nearest neighbor • The local reachability density of p (denoted by lrdk(p)) is defined to be 1/ k = 2 e e d d c c b b a a
Density-Based Model • The local outlier factor (LOF) of a point p is equal to
Density-Based Model • Idea C2 Local reachability density is high Local reachability density is low C1 b The ratio of these densities is large outlier a