Download
1 / 8
80 likes | 170 Views
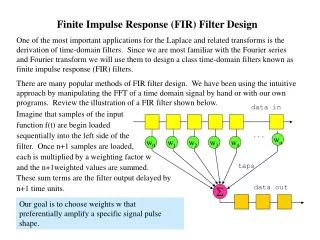
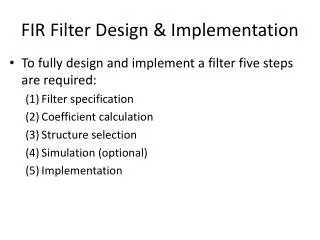
Lab 8 Window based FIR filter. Using SystemView. Window based FIR filter. Lab objective Use SystemView to simulate/analyze the window based filter we implemented with Matlab in Lab 7.

E N D
Lab 8 Window based FIR filter Using SystemView
Window based FIR filter Lab objective Use SystemView to simulate/analyze the window based filter we implemented with Matlab in Lab 7. If all goes well, next week we’ll do a realtime implementation of this filter using the Analog Devices EZ-Kits.
Window based FIR filter Launch SystemView. Construct a system using an operator, a source and a sink. Make the sample rate 8000 Hz Make the operator one of the “Filters / Systems” type. Select “Linear Sys. Filter” Set its parameters as follows: Set “No. Numerator Coeffs” to 29 (for a 29 tap FIR filter) and set “No. Denominator Coeffs” to 1 (no feedback terms in an FIR filter). Make the single denominator coefficient 1.0
Window based FIR filter Download the file coeffs.txt import it into the simulation by clicking on FileOpen Coefficient File (in the parameter dialog). Select “Text” for the data format, then click on “Select File”. Choose the file you downloaded. Click OK, then OK again. The coefficients should appear in the parameter dialog. Press the “Time” button, and you’ll see the impulse response. The dialog should now look like this:
Window based FIR filter You can now look at the filter’s frequency response by pressing “Gain”, and you can try the other buttons. Turn in a screen shot of the gain plot. Edit the source token. Make it a sinusoid, amplitude = 1, frequency = 1500 Hz. Make the sink token a Systemview graphic token. Run the simulation. The result should look like this: (note that 1500 Hz is in the passband) Turn in a screen shot.
Window based FIR filter Run it again, but make the input frequency 3 KHz. (in the stopband. Turn in a screen shot.