Download
1 / 21
270 likes | 478 Views
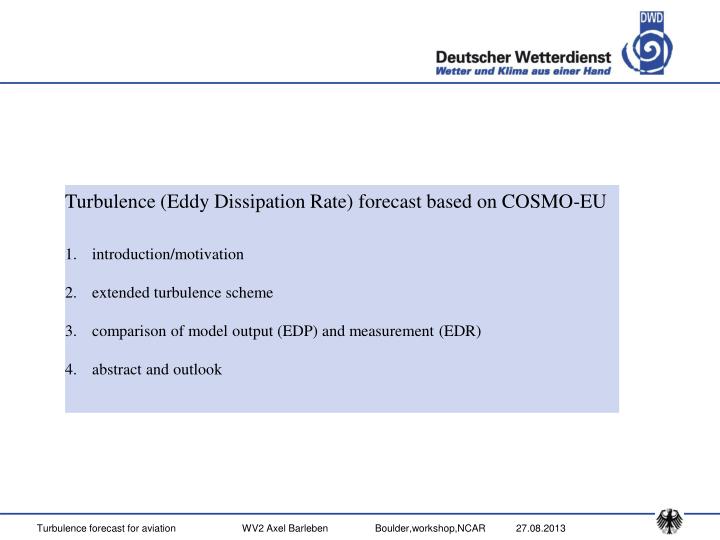
Turbulence (Eddy Dissipation Rate) forecast based on COSMO-EU introduction/motivation extended turbulence scheme comparison of model output (EDP) and measurement (EDR) abstract and outlook. introduction/motivation. Department Aviation Meteorology of DWD

E N D
Turbulence (Eddy Dissipation Rate) forecast based on COSMO-EU • introduction/motivation • extended turbulence scheme • comparison of model output (EDP) and measurement (EDR) • abstract and outlook
introduction/motivation Department Aviation Meteorology of DWD -is responsible for the meteorological support of the Civil Aviation in Germany - the German Meteorological Service Deutscher Wetterdienst (DWD) is a federal authority under the Federal Ministry of Transport, Building and Urban Affairs - DWD operates five regional advisory centres for IFR and VFR traffic - three of them act as Meteorological Watch Offices for aviation weather watch and warning (MWO) resulted from the german airspace structure (3 Flight Information Regions up to FL245, 2 Upper air Information Regions above Fl245) FIR Bremen FIR Langen FIR München
1. introduction/motivation products containing turbulence forecast - SIGMET (severe turb FIR/UIR) - GAMET/AIRMET (moderate turb) - AIREP (observation) PIREP (obs) - reports (mod,sev for FIR) - Low Level SWC Central Europe (up to FL 245) - wind shear (up to 1600 ftgnd , rep or exp) (METAR/COMMENTS/WARNING) - briefing for pilots Turbulence forecast between surface and FL450 with accuracy 1000 ft support for prediction? - General advices about CAT-prone areas - Threshold values of horizontal/vertical wind shear of Richardson number of Ellrod-index - CAT(Maximum)%, WAFC - SWC WAFC appropriate forecast tools ? Valid usual method : turbulence is predicted (SIGMET) after turbulence is observed(PIREP) => require an improvement of turbulence forecast method
1. introduction/motivation eddy dissipation rate [m**(2/3)/s] ICAO ANNEX3 Appendix 6 /4.2.6 Criteria related to phenomena included in SIGMET and AIRMET: SEV TURB EDR > 0.7 MOD TURB 0.4< EDR <= 0.7 ? -strategic decision of DWD (aeronautical meteorological department) after preliminary studies -development Eddy Dissipation Parameter derived from local model COSMO-EU -measurement of atmospheric turbulence , not directly -not available over Europe -alternative indicator of turbulence is the Derived Equivalent Vertical Gust Velocity (DEVG available , low quantity )
1. introduction/motivation Current thresholds derived from comparison EDR/PIREPS Julia M. Pearson,R.Sharman Calibration of in situ eddy dissipation rate (EDR) severity thresholds based on comparisons to turbulence pilot reports (PIREPs) 16th Conference ARAM,Austin,2013 Pearson,Sharman 2013 0.014lgt , 0.124mod , 0.345sev Pettegrew et al. 2010 : PIREP/ACARS => 0.15 lgt, 0.35 mod, 0.55 sev ICAO ANNEX3 Appendix 6 SEV TURB EDR > 0.7 MOD TURB 0.4< EDR <= 0.7 forexample: sevturb edr076 final aim => EDP (from model output) reproduce the EDR (measurement)
2. extended turbulence scheme COSMO-EU -for operational NWP -nested within GME on a 665x657 grid with 40 layers mesh size 7km -based on the primitive hydro thermo dynamical equations -describing compressive no hydrostatic flow -formulated in rotated geographical coordinates -generalized terrain-following vertical coordinate - turbulence scheme (Raschendorfer,DWD) prognostic level 2.5 closure for the prognostic tke–equation tke - direct model output (DMO) http://www.cosmo-model.org/ content/model/documentation/ core/default.htm
2. extended turbulence scheme Kolmogorov (1941) tke is only a function of edr Lp - turbulence length scale α – dissipation constant ³√ Eddy Dissipation Parameter
prognostic tke–equation in principle and simplify - new turbulence scheme Raschendorfer, M.: Further steps towards a scale separated turbulence scheme. 13th COSMO General Meeting, Rome, Italy, 2011 2. extended turbulence scheme • wake vortices by SSO (sub grid scale orography) blocking • horizontal shear vortices • shallow and deep convection patterns eddy-dissipation rate(EDR) transport (advection diffusion) shear production by sub grid scale circulations time tendency of tke shear production by the mean flow buoyancy production + + = + + labile : > 0 stable : < 0 neutral : = 0
2. extended turbulence scheme scale separation approach and turbulence scheme Sub grid scale Kinetic Energy = Turbulent Kinetic Energy + non turbulent Circulation phrased as Sc , scale interaction termsof Kinetic Energy SKE = TKE + CKE TKE CKE Equilibrium of energy production (source terms Qc) and scale interaction term similar to parameterization edr
TKE-production by separated horizontal (vertical) shear modes: 2. extended turbulence scheme Equilibrium of production and scale transfer towards turbulence - effective scaling parameter du2 dv1 du3 dw1 dv3 dw2 du1 dv2 dw3 partial derivatives from components of velocity HSH=DEF**2+DIV**2 ; ELD=VSH*(DEF-DIV) DST=du1-dv2 DSH=dv1+du2 DIV=-(du1+dv2) DEF=SQRT(DST**2+DSH**2) VSH=du3**2+dv3**2 TSV~VSH TSV=VSH+dw1**2+dw2**2+dw3**2 = (HSH+TSV)
2. extended turbulence scheme TKE-production by separated wake modes due to SSO: - blocking Term according Lott und Miller (1997) - describe breaking gravity wave after vertical propagation (and no horizontal) - is estimated currently (SSO-scheme COSMO-EU) - momentum sink due to friction of sub grid scale orography Equilibrium of production and loss by scale transfer
2. extended turbulence scheme TKE-production by convection (thermal circulations) moist convection according Tiedke (1987) mass flux convection scheme is installed in COSMO-EU TKE-production can be derived directly vertical velocity scale of circulation virtual potential temperature of ascending air virtual potential temperature of descending air Equilibrium of production and loss by scale transfer
3. comparison of EDP and EDR maxEDR is measured by commercial aircrafts available over the USA COSMO-EU => COSMO-US was nested over US domain COSMO-US : dlam/dphi = 0.0625 ie = 353 je = 314 ke = 40 philu = -9.075 (startlat) lamlu = -12.608 (startlon) pollon = -86.0 pollat = -53.0 dt = 40 Data structurewinter 2010/11 (01.10-31.3) 495 GB grib1 COSMO-US 62 GB netCDF ACARS from MADIS archive
3. comparison of EDP and EDR Share of the 5 % (events from in all) moderate or greater turbulence above 6400 m Climatology of Upper-Level Turbulence over the Contiguous United States J. K. WOLFF , R. D. SHARMAN, Journ.Appl. Meteor. and Clim.,Vol 47,2008 Turbulence in clouds (convection, CIT) and near lower shear zone of jet PIREP database 10-20-times more likely as near core of jet and upper shear zone , of prime importance FIG. 14. Vertical profile of the yearlyaveraged MOG/total divided by the globally averaged MOG/total background value of 0.32 stratified by in cloud and clear air as well as by season (October–March, dashed lines; April–September, thin solid lines;yearly average, thick solid lines).
3. comparison of EDP and EDR statistical evaluation and 5% MOG/ 95% NoTurb turbulence events (MOG) can’t bring a return with this distribution training data set - large number of examples from each class no change of class distribution in the validation data random-sampling to decrease NoTurb-examples sensitivity-test for several distributions best arrangement 40%MOG/60%NoTurb use only for model output statistic confirmed “I have used the 40% MOG (60% null) distribution because it worked well with all the machine learning algorithms” Dissertation : A Domain Analysis Approach to Clear-Air Turbulence Forecasting Using High-Density In-situ Measurements by Jenny A. Abernethy M.S., University of Colorado, 2004
3. comparison of EDP and EDR -model output statistic => classical linear regression -is used to relate the response variable (predictand,Y=maxEDR) to the explanatory variables (predictors Xi = p,v,w,tke,.. eld,div,dsh,ri,Qc…) -Maximum likelihood estimates of β1…βparefounded by least squares fitting after linear regressionstep 2 edp_mos=β0+β1*DEN+β2*edp initial situation maxEDR/edp >6400m,485513 events(40/60) after linear regressionstep 1 edp_mos=β0+β1*DEN edp
3. comparison of EDP and EDR Simply density is a significant predictor for maxEDR , ? -edp from COSMO only kinematic variable -maxEDR use required input TAS ( ) -use density adjustment for model output because turbulence is higher for more dense air mass -need further source term for tke-equation involved density Qc_? = Qc_? f(den), gravity wave -maxEDR data seem to be biased by flight activities (influence of aircrafts ahead, higher for low level flights)
3. comparison of EDP and EDR validation of full set of data about 4 million couples of measurement/model above FL210. Receiver Operating Characteristic objectivefromTurbulenceJoint SafetyImplementation Team (TJSIT) III: numerical tests, idea additional source term depend on density IV: MOS with 1 step (predictor) (ϱ/ϱ₀)³edp evsep=0.12 ( no-turb/yes-turb for III,IV)
4. outlook / abstract Comparison EDR and EDP -useful for verification of turbulence forecast (edp) with real measurement (edr) -appropriate for optimization of turbulence parameterization (scaling factor for QC_SHS, tubulent length scale, density-adjustment) -MOS (no improvement after step 2) needs other or further indices (or combinations) -edp ( tke-equation) because additive correction require further source-terms (advection) -Qc_con only add in case of CIT, “limiting value” ? -FAA-EDR standards, expanded to Europe , understanding (density) -turbulence scheme in global model ICON (20 km,60-90 levels) ~ 2014 -thresholds edp ? tendency : light events to strong, severe events to weak -EDP reproduce EDR inexactly -aviation forecaster (DWD) apply EDP and Ellrod-index for turbulence prediction (example 14.2.2013)
4. outlook / abstract COSMO-EU forecast of eddy dissipation parameter ARS: MODERATE TO SEVERE TURB OBS FL180-240, FL360, 6-8UTC Figure: forecast EDP COSMO-EU , Maximum level 10-19 (FL180-360), 14.02.2013 06 UTC (method : sum up different levels “3d”) several PIREPS reported mod to sev along 10 degree of longitude
3. comparison of EDP and EDR third dimension animation of ELD > 6.0 10**-7 s**-2 (sev turb) 14.2.2013, 06 UTC