Download
1 / 30
300 likes | 372 Views
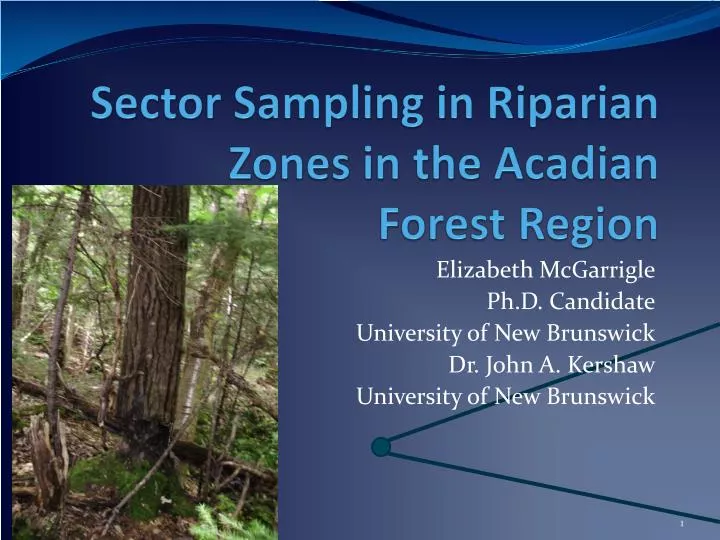
Sector Sampling in R iparian Zones in the Acadian Forest Region. Elizabeth McGarrigle Ph.D. Candidate University of New Brunswick Dr. John A. Kershaw University of New Brunswick. Geometry, hornets, water and trees. Elizabeth McGarrigle Ph.D. Candidate

E N D
Sector Sampling in Riparian Zones in the Acadian Forest Region Elizabeth McGarrigle Ph.D. Candidate University of New Brunswick Dr. John A. Kershaw University of New Brunswick
Geometry, hornets, water and trees Elizabeth McGarrigle Ph.D. Candidate University of New Brunswick Dr. John A. Kershaw University of New Brunswick
Sampling in Riparian Zones • Typically higher species richness • Slope, drainage, soils - heterogeneity • To capture full range of species, need to capture full range of growing conditions • Sampling high perimeter to area ratio • Traditional sampling schemes • Boundary overlap/slop over • Requires boundary overlap correction • Alternatives?
What is sector sampling? • Developed for use in small patches left after harvest (Iles and Smith 2006) • Eliminates bias caused from edge effect • No correction required for boundary overlap – plot ends at boundary • Plot placed anywhere in patch, random azimuth determined and predetermined angle used to project plot to stand boundary • Single or balanced sector
What is sector sampling? • Developed for use in small patches left after harvest (Iles and Smith 2006) • Eliminates bias caused from edge effect • No correction required for boundary overlap – plot ends at boundary • Plot placed anywhere in patch, random azimuth determined and predetermined angle used to project plot to stand boundary • Single or balanced sector
Is Sector Sampling Applicable? • Advantages in riparian zones • No boundary overlap correction required • No predetermined sampling location required • Possible disadvantages • Azimuth down middle of stand = High number of trees • Is it efficient?
Overall Objective • How does sector sampling compare with traditional sampling methods in riparian zones? • Ability to quantify: • Density • Basal area • Species composition • Options: • Implement each method in the field • Tree map riparian zone and simulate sampling methods
The Riparian Zone • 373 meter stretch of stream • 1050 trees stem mapped, diameter measured
The Riparian Zone • 12 species total (balsam fir, largetooth aspen, red maple) • 1400 trees/ha • 26 m^2/ha • 15 cm quadratic mean diameter
The Riparian Zone • Lots of corners • Some dropped tapes • 4 hornet/bee nests
Sampling Types • Circular fixed area plots corrected using walkthrough method • Angle count sampling (ACS) boundary overlap corrected using walkthrough method • Strip plots perpendicular to stream • Sector Sampling • Riparian zone divided into 6 sections and sampling types simulated
Strip Plots • First strip randomly placed in first 20 meters
Strip Plots • 2nd and 3rd strips each 20 meters downstream • Two size strips sampled: • 2m • 4m
Point LocationsOn Strip • On each strip one point location on each side of stream • 6 points total • Each point: • Fixed area, ACS and Sector plots
Circular Plots • Two sizes sampled: • 3.01 meter radius (1/350th of hectare) • 4.61 meter radius (1/150thof hectare)
Sector Plots • Two sizes sampled: • 10 ° angle • 20° angle
Centered Balanced Sector Plots • Two sizes sampled: • 10 ° angle/4 • = 2.5° per sector • 20° angle/4 • = 5 ° per sector
Looking at the Data • Observed and predicted graphs of density and species composition • By section • Overall • Overall basal area • Average error over 6 sections • Observed density • Observed species comp • Average error versus number of trees measured
Density • Black – larger plots • Red – smaller plots • Generally all types clustered around observed • Plot sizes not significantly different in majority of sections • 3/6 sections sector plots are above all other types
Density • Black – larger plots • Red – smaller plots • Balanced sector underestimates overall density
Species Composition • ASH – ash • BE – beech • BF – balsam fir • GB – grey birch • LA – largetooth aspen • RM – red maple • SM – sugar maple • SP – spruce • STM – striped maple • WB – white birch • WP – white pine • YB – yellow birch
Species Composition Overall Small Plots Large Plots
Basal area • Black – larger plots • Red – smaller plots • ACS and Strip sampling closest to observed • Centralized sector is underestimating basal area
Average Error of Density • Black – larger plots • Red – smaller plots • Centered sector has lower error and number of trees measured than single sectors • Strip plots have lowest error
red maple Average Error in Species Composition • Black – larger plots • Red – smaller plots largetooth aspen balsam fir
Conclusions • After 1050 trees, 4 nests(lots of stings), some equipment fishing and some simulation… • Variability in sector plots in density and species composition predictions • Centralized sector plots with balanced sectors performing better than single sectors • Strip plots more accurate in predicting overall density and require fewer trees measured than other types
What’s next? • Are the results consistent? • Run simulation of sampling scheme again • Different size sector angles • Different configuration for the balanced sectors • 3 or 4 sectors per point? • Optimal angle to use?
Acknowledgements Questions? • John Kershaw – Fisherman, nest marker, dog bringer and simulation coder