Download
1 / 16
160 likes | 260 Views
Tracer transport simulation by an icosahedral grid model. Center for Climate System Research, Univ. of Tokyo Yosuke Niwa R. Imasu, M. Satoh, S. Maksyutov, T. Machida, H. Matsueda. NICAM Nonhydrostatic ICosahedral Atmospheric Model.

E N D
Tracer transport simulation by an icosahedral grid model Center for Climate System Research, Univ. of Tokyo Yosuke Niwa R. Imasu, M. Satoh, S. Maksyutov, T. Machida, H. Matsueda
NICAM Nonhydrostatic ICosahedral Atmospheric Model • NICAM was first developed by Satoh (CCSR/FRCGC)and H. Tomita (FRCGC). (H. Tomita and M. Satoh, 2004, M. Satoh et al., 2007) • Developed as a global cloud resolving model (GCRM). The max resolution… dx~3.5km • NICAM is also used as a low-resolution Atmospheric Circulation Model (AGCM) and as a regional model (Stretch-NICAM). I used NICAM as a AGCM and modified it an on-line tracer transport model. I added new tracers and developed nudging module resolution…dx~240km
Realistic experiment by NICAM A 3.5km-mesh global simulation was performed using the Earth Simulator. (H. Miura et al., 2007) dx~3.5km OLR (by H. Miura) http://www.ccsr.u-tokyo.ac.jp/~satoh/nicam/index.html
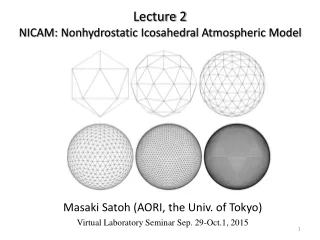
Grids of NICAM Horizontal grid: Regional model version: recursively divided icosahedral grid stretched grid Vertical grid: Terrain-following coordinate: It looks like σ coordinate, but doesn’t depends on pressures and is not time-variable.
Advantages of NICAM for tracer transport simulations • High-resolution if I could use the Earth Simulator • Tracer masses are completely conserved without a mass fixer Tracer advection is consistent with continuity • Easy to develop adjoint code no limiters or fixers, not semi-Lagrangian scheme →good properties for high-resolving inverse method. Since NICAM is a new model, evaluation of the model performance is needed.
The setting of NICAM • Horizontal resolution: dx~240km • The number of vertical layers: 54 • Time step: 20 min • Advection scheme : Miura2004 scheme (horizontal) 2nd order difference (vertical) • Cumulus convection : simplified prognostic Arakawa- Schubert • Vertical diffusion : Mellor-Yamada 2with modification by Smith (Smith, 1990) • Analysed fields used for nudging: NCEP, JRA (not submitted to TC cont.) • Meteorological variables used for nudging: U , V (τ=0.7day), T (τ=3day) Nudged only for the free troposphere (12th layer ~) not nudged in boundary layers
Evaluation of meridional transport comparison with TransCom 3 models ① tracer : fossil fuel 1990 Surface 500hPa The North-South gradient simulated by NICAM is smaller than other models.
Evaluation of meridional transport comparison with TransCom 3 models ② TransCom 3 models tracer : fossil fuel 1990 stronger inter-hemispheric transport NICAM
CTL sub-grid transport by cumulus convection was reduced by half dynamical field simulated by NICAM is not problem cumulus convection hardly affect! ½ cumulus effect Nudged Large scale advection is the cause of inter-hemispheric transport Due to the advection scheme of NICAM ?
SF6 simulationTransCom 2 experiment S. Denning et al., 1999 NICAM
Comparison with TransCom continuous data experiment models NICAM observation fossil98 SF6 Inter-hemispheric transport of NICAM is still seemed to be stronger SF6 observation data were downloaded from WDCGG site
Vertical transport: 222Rn simulationComparison with Jacob, et al., 1997 winter summer obs. upper air PBL Green: other models, Blue: NICAM (V: not nudged, X: JRA, Y: NCEP) Although there is an uncertainty of radon fluxes, the vertical transport simulated by NICAM is seemed to be a little stronger than others in summer.
Comparison with continuous data at Hateruma DJF JJA + R SiB CASA blue:SiB, green:CASA, red:observation Except in summer, high CO2 air from continental PBL was captured well. Observation data were downloaded from WDCGG site
Comparison with aircraft data Vertical profile @ Novosibirsk (West Siberia) Boundary layer was simulated well Upper air by JAL airplane (Tokyo-Sydney) NICAM observation S ← latitude → N convected high CO2 air z OLR Siberia data were provide by T. Machida (NIES) JAL data were provided by H. Matsueda (MRI)
Summary and Perspective • Introduction of NICAM • NICAM is a new model developed as a global cloud resolving model. • The grids of NICAM are very different. • Comparison with TransCom models • Inter-hemispheric transport simulated by NICAM is stronger than other models • The model results are in the range of other model results and in good agreement with observations. • Comparison with observations • Synoptic scale variations were captured well. • Small scale variation of atmospheric CO2 were reproduced. • Perspective • Development of high-resolving inverse model
Thank you! Acknowledgement The datasets used for this study are provided from the cooperative research project of the JRA-25 long-term reanalysis by Japan Meteorological Agency (J MA) and Central Research Institute of Electric Power Industry (CRIEPI). NCEP Reanalysis data were provided by the NOAA/OAR/ESRL PSD, Boulder, Colorado, USA, from their Web site at http://www.cdc.noaa.gov/. Aircrafts observation data at Siberia sites were offered from T. Machida (NIES) and JAL observation data were offered from H. Matsueda (MRI).