Download
1 / 1
10 likes | 93 Views
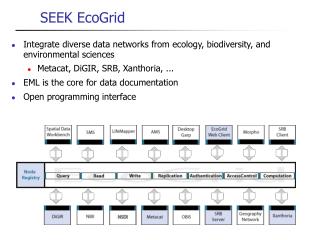
Data Portal National flora & fauna database Data entry Data QA. dragonflies. plants. Fish +. fungi. mollusca. mammals. moss & lichens. birds. butterflies. Landscape. Taxonomy. Social economic. Weather. Vl-e and GRID technology. Spatial modeling toolbox. The Ecogrid framework.

E N D
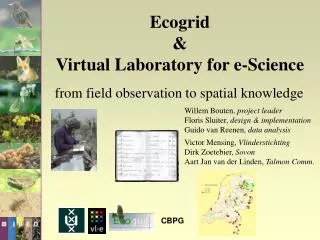
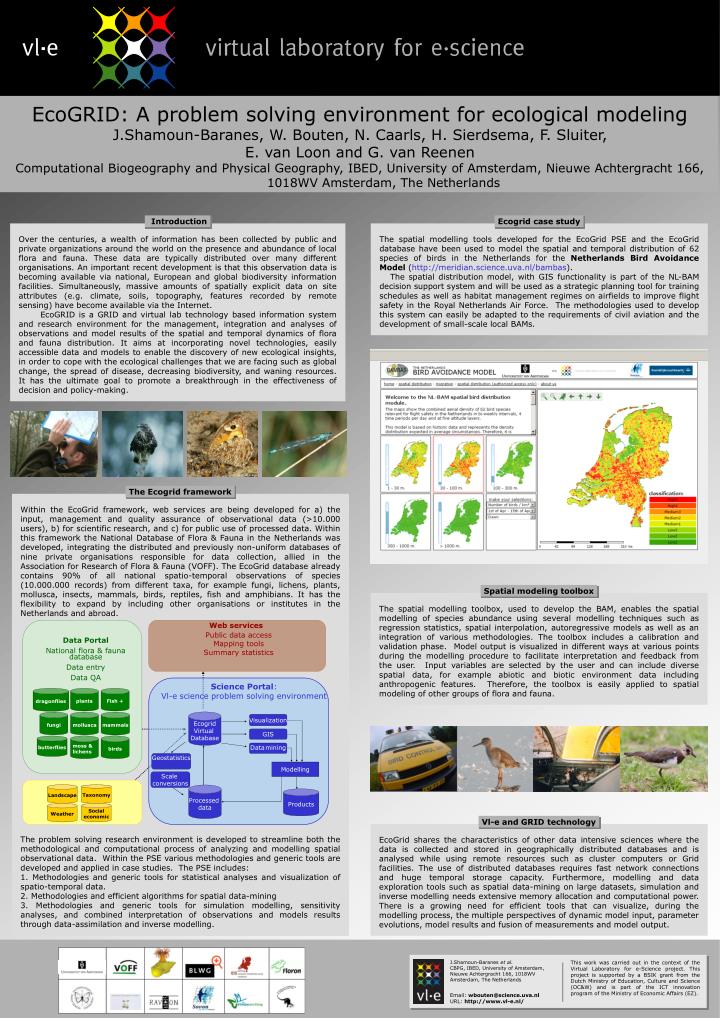
Data Portal National flora & fauna database Data entry Data QA dragonflies plants Fish + fungi mollusca mammals moss & lichens birds butterflies Landscape Taxonomy Social economic Weather Vl-e and GRID technology Spatial modeling toolbox The Ecogrid framework Ecogrid case study Introduction Over the centuries, a wealth of information has been collected by public and private organizations around the world on the presence and abundance of local flora and fauna. These data are typically distributed over many different organisations. An important recent development is that this observation data is becoming available via national, European and global biodiversity information facilities. Simultaneously, massive amounts of spatially explicit data on site attributes (e.g. climate, soils, topography, features recorded by remote sensing) have become available via the Internet. EcoGRID is a GRID and virtual lab technology based information system and research environment for the management, integration and analyses of observations and model results of the spatial and temporal dynamics of flora and fauna distribution. It aims at incorporating novel technologies, easily accessible data and models to enable the discovery of new ecological insights, in order to cope with the ecological challenges that we are facing such as global change, the spread of disease, decreasing biodiversity, and waning resources. It has the ultimate goal to promote a breakthrough in the effectiveness of decision and policy-making. EcoGrid shares the characteristics of other data intensive sciences where the data is collected and stored in geographically distributed databases and is analysed while using remote resources such as cluster computers or Grid facilities. The use of distributed databases requires fast network connections and huge temporal storage capacity. Furthermore, modelling and data exploration tools such as spatial data-mining on large datasets, simulation and inverse modelling needs extensive memory allocation and computational power. There is a growing need for efficient tools that can visualize, during the modelling process, the multiple perspectives of dynamic model input, parameter evolutions, model results and fusion of measurements and model output. The spatial modelling toolbox, used to develop the BAM, enables the spatial modelling of species abundance using several modelling techniques such as regression statistics, spatial interpolation, autoregressive models as well as an integration of various methodologies. The toolbox includes a calibration and validation phase. Model output is visualized in different ways at various points during the modelling procedure to facilitate interpretation and feedback from the user. Input variables are selected by the user and can include diverse spatial data, for example abiotic and biotic environment data including anthropogenic features. Therefore, the toolbox is easily applied to spatial modeling of other groups of flora and fauna. The spatial modelling tools developed for the EcoGrid PSE and the EcoGrid database have been used to model the spatial and temporal distribution of 62 species of birds in the Netherlands for the Netherlands Bird Avoidance Model (http://meridian.science.uva.nl/bambas). The spatial distribution model, with GIS functionality is part of the NL-BAM decision support system and will be used as a strategic planning tool for training schedules as well as habitat management regimes on airfields to improve flight safety in the Royal Netherlands Air Force. The methodologies used to develop this system can easily be adapted to the requirements of civil aviation and the development of small-scale local BAMs. Within the EcoGrid framework, web services are being developed for a) the input, management and quality assurance of observational data (>10.000 users), b) for scientific research, and c) for public use of processed data. Within this framework the National Database of Flora & Fauna in the Netherlands was developed, integrating the distributed and previously non-uniform databases of nine private organisations responsible for data collection, allied in the Association for Research of Flora & Fauna (VOFF). The EcoGrid database already contains 90% of all national spatio-temporal observations of species (10.000.000 records) from different taxa, for example fungi, lichens, plants, mollusca, insects, mammals, birds, reptiles, fish and amphibians. It has the flexibility to expand by including other organisations or institutes in the Netherlands and abroad. The problem solving research environment is developed to streamline both the methodological and computational process of analyzing and modelling spatial observational data. Within the PSE various methodologies and generic tools are developed and applied in case studies. The PSE includes: 1. Methodologies and generic tools for statistical analyses and visualization of spatio-temporal data. 2. Methodologies and efficient algorithms for spatial data-mining 3. Methodologies and generic tools for simulation modelling, sensitivity analyses, and combined interpretation of observations and models results through data-assimilation and inverse modelling. Web services Public data access Mapping tools Summary statistics Science Portal: Vl-e science problem solving environment EcogridVirtual Database Visualization GIS Datamining Geostatistics Modelling Scale conversions Processed data Products EcoGRID: A problem solving environment for ecological modeling J.Shamoun-Baranes, W. Bouten, N. Caarls, H. Sierdsema, F. Sluiter, E. van Loon and G. van Reenen Computational Biogeography and Physical Geography, IBED, University of Amsterdam, Nieuwe Achtergracht 166, 1018WV Amsterdam, The Netherlands J.Shamoun-Baranes et al. CBPG, IBED, University of Amsterdam, Nieuwe Achtergracht 166, 1018WV Amsterdam, The Netherlands Email: wbouten@science.uva.nl URL: http://www.vl-e.nl/