Download
1 / 15
160 likes | 333 Views
Analysis of Variance (ANOVA) Comparing means between three or more groups. Photo credit: http://www.stattucino.com/. Agenda. Lab Stuff: Questions and Clarifications? Analysis of Variance (ANOVA). Analysis of Variance.

E N D
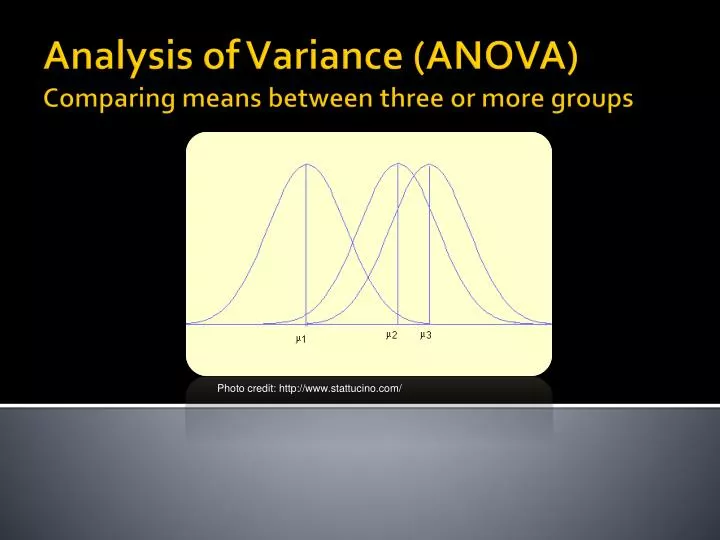
Analysis of Variance (ANOVA)Comparing means between three or more groups Photo credit: http://www.stattucino.com/
Agenda • Lab Stuff: Questions and Clarifications? • Analysis of Variance (ANOVA)
Analysis of Variance • In its simplest form, it is used to compare means for three or more categories. • Example: • Income (metric) and Marital Status (many categories) • Relies on the F-distribution • Just like the t-distribution and chi-square distribution, there are several sampling distributions for each possible value of df.
The problem with multiple t-tests • Consider comparing means between average incomes and US States. For example: • California vs. Idaho • Idaho vs. Colorado • North Carolina vs. South Carolina • New York vs. Texas • ….etc • How do you know that income actually varies by State? What is the basis for comparison?
What is ANOVA? • If we have a categorical variable with 3+ categories and a metric/scale variable, we could just run 3 t-tests. • One problem is that the 3 tests would not be independent of each other (i.e., all of the information is known). • As number of comparisons grow, likelihood of some differences are expected– but do not necessarily indicate an overall difference. • A better approach: compare the variability between groups (treatment variance + error) to the variability within the groups (error)
The F-ratio • MS = mean square • bg = between groups • wg = within groups • The numerator and denominator have their own degrees of freedom • Between groups df = the number of categories - 1, or (k-1) • Within groups df = N - # of categories (N – k)
Interpreting the F-ratio • Generally, an f-ratio is a measure of how different the means are relative to the variability within each sample • Larger values of F greater likelihood that the difference between means are not just due to chance alone
Null Hypothesis in ANOVA • If there is no difference between the means, then the between-group sum of squares should = the within-group sum of squares.
F-distribution • F-test for ANOVA is a one-tailed test. • A right-skewed distribution • It is a ratio of two chi-square distributions
Visual ANOVA and f-ratio http://tinyurl.com/271ANOVA
ANOVA and t-test: Correcting for multiple comparisons • How do we know where the differences exist once we know that we have an overall difference between groups? • t-tests become important after an ANOVA so that we can find out which pairs are significantly different (post-hoc tests). • Certain ‘corrections’ can be applied to such post-hoc t-tests so that we account for multiple comparisons (e.g., Bonferroni correction, which divides the desired p-value by the number of comparisons being made) • If you want an alpha of .05 and have 3 comparisons, you need to get at least p =.017 (.05 / 3) to be confident in the statistical significance of the result. If you raise it to 4 comparisons it would be p = .0125…and so on. • There are many means comparisons test available (Tukey, Sidak, Bonferroni, etc). The tests differ in how conservatively they estimate the p-value.
Logic of the ANOVA • Class Example: • anova.do • GSS96_small.dta
ANOVA in Experiments • Very common statistical technique for examining experiment data. Three common types of models include: • Fixed-effects models • E.g., experimenter applies treatment and control (fixed treatments) • Random-effects models • E.g., experimenter examines the effect of some factor that is sampled from the population, such as “facebook usage” • Mixed-effects models • E.g., experimenter examines both fixed and random effects in the same ANOVA.