Download
1 / 9
90 likes | 179 Views
Respiration III. Partial pressure of gases O 2 and CO 2 transport in the blood Ventilation and acid-base balance. Partial pressure of gases. Dalton’s law - the total pressure of a gas mixture =.

E N D
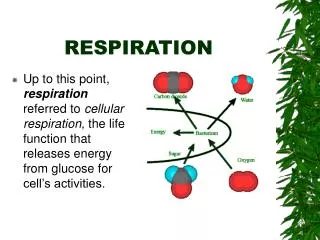
Respiration III • Partial pressure of gases • O2 and CO2 transport in the blood • Ventilation and acid-base balance
Partial pressure of gases • Dalton’s law - the total pressure of a gas mixture = the sum of the pressures that each gas would exert independently when the barometric pressure (PB) is 760 mm Hg the composition of atmospheric air is - GAS % FRACTION O2 20.93 .2093 CO2 00.03 .0003 N2 79.04 .7904 TOTAL 100 1.0
Calculation of partial pressures • The partial pressure of any gas can be calculated by multiplying PB by the fraction of the gas Examples - PO2 = 760 x .2093 PO2 = 159 mm Hg PN2 = 760 x .7904 PN2 = 600 mm Hg
O2 transport by the blood • 20 ml of O2 is carried by 100 ml of blood • 0.3 ml (1.5%) is dissolved in solution in plasma • four O2 molecules combine with Hb forming oxy-haemoglobin in a reversible reaction Hb + O2D HbO2 • arterial blood is fully saturated with O2 • the rest (98.5 %) is combined with iron (Fe2+) on haem units of haemoglobin (Hb) molecules in red blood cells
Oxyhaemoglobin dissociation curve • This relates the % saturation of Hb to the PO2 in blood • A high PO2 = loading (curveÚright) • A low PO2/reduced affinity = unloading (curveÙleft) • This is described by the ‘S’ shaped O2-Hb dissociation curve • Each O2 molecule binding to Hb increases the rate of binding of the next O2 molecule
100 80 60 40 20 20 40 60 80 100 ß PCO2, Ý pH, ß Temp Ý PCO2, ß pH Ý Temp % Saturation PO2 (mm Hg)
Effects of pH & temperature on O2-Hb • Active tissues = Û PCO2 & lactic acid = Û [H+] • Û [H+] weakens the bond between O2 & Hb • More O2 is released for a given PO2 when pH is lower • O2-Hb dissociation curve shifts to the right called the ‘Bohr effect’ • A similar shift to the right occurs with increased blood temperature around exercising skeletal muscle
CO2 transport by the blood • CO2 diffuses into blood in systemic tissue capillaries • 7 % remains dissolved in blood plasma • The rest (93%) diffuses into red blood cell (rbc) • In rbc - 23% binds to Hb =carbaminohaemoglobin - 70% converted into H2CO3 • H2CO3 dissociates into HCO3- &H+ • HCO3- diffuses into plasma in exchange with Cl- • H+ binds to buffers (Hb) • This process is reversed in the lung capillaries
Ventilation & acid-base balance • An increase in blood PCO2 leads to Û [H+] and this increases blood acidity (ÜpH) • A decrease in blood PCO2 has the opposite effect and the blood becomes more alkaline • Excessive ventilation will exhale more CO2 and Üblood PCO2 • Insufficient ventilation will result in a build-up of CO2 and Û blood PCO2