Download
1 / 24
240 likes | 333 Views
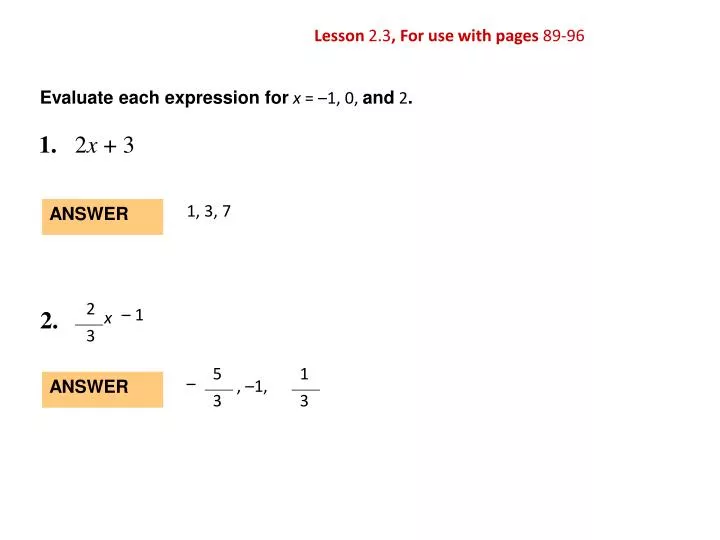
2. – 1. 2. x. 3. 5. 1. –. , –1,. ANSWER. 3. 3. Lesson 2.3 , For use with pages 89-96. Evaluate each expression for x = –1, 0, and 2. 1. 2 x + 3. 1, 3, 7. ANSWER. Lesson 2.3 , For use with pages 89-96. Evaluate each expression for x = –1, 0, and 2.

E N D
2 – 1 2. x 3 5 1 – , –1, ANSWER 3 3 Lesson 2.3, For use with pages 89-96 Evaluate each expression forx=–1, 0,and2. 1. 2x + 3 1, 3, 7 ANSWER
Lesson 2.3, For use with pages 89-96 Evaluate each expression forx=–1, 0,and2. 3.In 2005, Carey’s Pet Shop had a profit of $55,500. In 2006, profits were $38,700. In a graph of a data, is the segment between 2005 and 2006 positive or negative? negative ANSWER
b. a. y = x + 3 y = 2x a. EXAMPLE 1 Graph linear functions Graph the equation. Compare the graph with the graph of y = x. SOLUTION The graphs ofy = 2x andy = x both have a y-intercept of 0, but the graph ofy = 2x has a slope of2 instead of 1.
b. EXAMPLE 1 Graph linear functions The graphs ofy = x + 3 and y = x both have a slope of 1, but the graph ofy = x + 3has a y-intercept of 3 instead of 0.
Graph y = –x – 1. 2 3 EXAMPLE 2 Graph an equation in slope-intercept form SOLUTION STEP 1 The equation is already in slope-intercept form. STEP 2 Identify the y-intercept. The y-intercept is –1, so plot the point (0, –1) where the line crosses the y-axis.
2 3 – 2 Identify the slope. The slope is –, or , so plot a second point on the line by starting at (0, –1) and then moving down 2 units and right 3 units. The second point is (3, –3). 3 EXAMPLE 2 Graph an equation in slope-intercept form STEP 3
EXAMPLE 2 Graph an equation in slope-intercept form STEP 4 Draw a line through the two points.
1. y = –2x for Examples 1 and 2 GUIDED PRACTICE Graph the equation. Compare the graph with the graph of y = x. SOLUTION The graphs ofy =–2x andy = x both have a y-intercept of 0, but the graph ofy = –2x has a slope of–2instead of 1.
2. y = x – 2 for Examples 1 and 2 GUIDED PRACTICE Graph the equation. Compare the graph with the graph of y = x. SOLUTION The graphs ofy = x – 2 and y = x both have a slope of 1, but the graph ofy = x – 2has a y-intercept of –2instead of 0.
3. y = 4x for Examples 1 and 2 GUIDED PRACTICE Graph the equation. Compare the graph with the graph of y = x. SOLUTION The graphs ofy = 4x andy = x both have a y-intercept of 0, but the graph ofy = 4x has a slope of4 instead of 1.
2 5 5. y = x + 4 for Examples 1 and 2 GUIDED PRACTICE Graph the equation 4. y = –x + 2
1 2 6. y = x – 3 for Examples 1 and 2 GUIDED PRACTICE Graph the equation 7. y = 5 + x
for Examples 1 and 2 GUIDED PRACTICE Graph the equation 8. f (x) = 1 – 3x 9. f (x) = 10 – x
EXAMPLE 3 Solve a multi-step problem Biology The body length y (in inches) of a walrus calf can be modeled by y = 5x + 42 where xis the calf’s age (in months). • Graph the equation. • Describe what the slope and y-intercept represent in this situation. • Use the graph to estimate the body length of a calf that is 10 months old.
EXAMPLE 3 Solve a multi-step problem SOLUTION STEP 1 Graph the equation. STEP 2 Interpret the slope and y-intercept. The slope, 5,represents the calf’s rate of growth in inches per month. The y-intercept, 42, represents a newborn calf’s body length in inches.
EXAMPLE 3 Solve a multi-step problem STEP 3 Estimate the body length of the calf at age 10 months by starting at 10 on the x-axis and moving up until you reach the graph. Then move left to the y-axis.At age 10 months, the body length of the calf is about 92 inches.
for Example 3 GUIDED PRACTICE WHAT IF? In Example 3, suppose that the body length of a fast-growing calf is modeled by y = 6x + 48. Repeat the steps of the example for the new model.
for Example 3 GUIDED PRACTICE SOLUTION STEP 1 Graph the equation. STEP 2 The y-intercept, 48, represents the length of the newborn calf’s body. The slope, 6, represents the calf’s growth rate in inches per month. STEP 3 At age 10 months, the body length of the calf is about 108 inches.
EXAMPLE 4 Graph an equation in standard form Graph 5x + 2y = 10. SOLUTION STEP1 The equation is already in standard form. STEP2 Identify the x-intercept. Lety= 0. 5x + 2(0) = 10 x = 2 Solve for x. The x-intercept is 2. So, plot the point (2, 0).
EXAMPLE 4 Graph an equation in standard form STEP3 Identify the y-intercept. Lety= 0. 5(0) + 2y = 10 y = 5 Solve for y. The y-intercept is 5. So, plot the point (0, 5). STEP4 Draw a line through the two points.
EXAMPLE 5 Graph horizontal and vertical lines Graph (a) y = 2 and (b) x = –3. SOLUTION a. The graph of y = 2 is the horizontal line that passes through the point (0, 2). Notice that every point on the line has a y-coordinate of 2. b. The graph of x = –3 is the vertical line that passes through the point (–3, 0). Notice that every point on the line has an x-coordinate of –3.
for Examples 4 and 5 GUIDED PRACTICE Graph the equation. 12. 3x – 2y = 12 11. 2x + 5y = 10
for Examples 4 and 5 GUIDED PRACTICE Graph the equation. 13. x = 1 14. y = –4