Download
1 / 16
180 likes | 377 Views
Analysis of ChIP-Seq Data. Biological Sequence Analysis BNFO 691/602 Spring 2014 Mark Reimers. What Are the Questions?. Where are histone modifications? Where do TFs bind to DNA? Where do miRNAs or RNABPs bind to 3’ UTRs? How different is binding between samples?. Why ChIP-Seq?.

E N D
Analysis of ChIP-Seq Data Biological Sequence Analysis BNFO 691/602 Spring 2014 Mark Reimers
What Are the Questions? • Where are histone modifications? • Where do TFs bind to DNA? • Where do miRNAs or RNABPs bind to 3’ UTRs? • How different is binding between samples?
Why ChIP-Seq? • ChIP-Seq is ideal (and is now the standard method) for mapping locations where regulatory proteins bind on DNA • Typically ‘only’ 2,000 - 20,000 active binding sites with footprint ~200-400 base pairs • Similarly ChIP-Seq is fairly efficient for mapping uncommon histone modifications and for RNA Polymeraseoccupancy , because the genomic regions occupied are very narrow
Chromatin Immuno-Precipitation Chromatin Immuno-Precipitation (ChIP) is a method for selecting fragments from DNA near specific proteins or specific histone modifications From Massie, EMBO Reports, 2008
Chromatin Immuno-precipitation • Proteins are cross-linked to DNA by formaldehyde or by UV light • NB proteins are even more linked to each other than to DNA • DNA is fragmented • Antibodies are introduced • NB cross-linking may disrupt epitopes • Antibodies are pulled out (often on magnetic beads) • DNA is released and sequenced
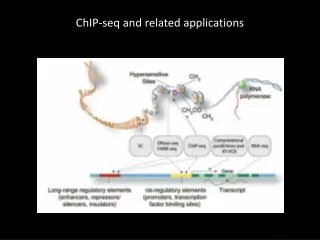
CLIP-Seq – A Related Assay • Cross-linking immuno-precipitation (CLIP)-Seq is used to map locations of RNA-binding proteins on mRNA • Even miRNA binding can be mapped indirectly by CLIP-Seq with antibodies raised to Argonaute – an miRNA accessory protein
What ChIP-Seq Data Look Like From Rozowsky et al, Nature Biotech 2009
The Value of Controls: ChIP vs. Control Reads NB. Non-specific enrichment depends on protocol Need controls for every batch run Red dots are windows containing ChIP peaks and black dots are windows containing control peaks used for FDR calculation
Goals of Analysis • Identify genomic regions - ‘peaks’ – where TF binds or histones are modified • Quantify and compare levels of binding or histone modification between samples • Characterize the relationships among chromatin state and gene expression or splicing
General Characteristics of ChIP-Seq Data • Fragments are quite large relative to binding sites of TFs • ChIP-exo(ChIP followed by exonuclease treatment) can trim reads to within a smaller number of bases • Histone modifications cover broader regions of DNA than TFs • Histone modification measures often undulate following well-positioned nucleosomes
ChIPReads Pile Up in ‘Peaks’ at TF Binding Sites on Alternate Strands
ChIP-Seq for Transcription Factors • Typically several thousand distinct peaks across the genome • Not clear how many of lower peaks represent low-affinity binding sites From Rozowsky et al, Nature Biotech 2009
ChIP-Seq for Polymerase • Fine mapping of Pol2 occupancy shows peaks at 5’ and 3’ ends From Rahl et al Cell 2010
ChIP-Seq Histone Modifications • Many histone modifications are over longer stretches rather than peaks • May have different profiles • Not clear how to compare
Issues in Analysis of ChIP-Seq Data • Many false positive peaks • How to use controls in data analysis • How to count reads starting at same locus • What are appropriate controls? • Naked DNA, untreated chromatin, IgG • Some DNA regions are not uniquely identifiable – ‘mappability’ • How to compare different samples? • Overlap between peak-finding algorithm results are often poor
Mapability Issues • Many TFBS and histone modifications lie in low-complexity or repeat regions of DNA • With short reads (under 75 bp), with some errors, it may not be possible to uniquely identify (map) the locus of origin of a read • UCSC provides a set of mapability tracks • Select Mapping and Sequencing Tracks • Select Mapability • 35, 40, 50 & 70-mer mapability (some with different error allowances)