Download
1 / 49
490 likes | 601 Views
4%. 4-6%. 6%. n/a. Source: Mokdad et al., Diabetes Care 2000;23:1278-83. Prevalence of Diabetes among U.S. Adults, BRFSS, 1990. 4%. 4-6%. 6%. n/a. Source: Mokdad et al., Diabetes Care 2000;23:1278-83. Prevalence of Diabetes among U.S. Adults, BRFSS, 1991-92. 4%. 4-6%. 6%. n/a.

E N D
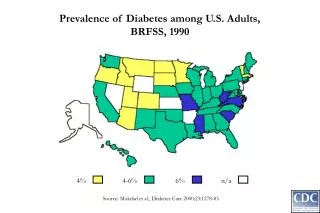
4% 4-6% 6% n/a Source: Mokdad et al., Diabetes Care 2000;23:1278-83 Prevalence of Diabetes among U.S. Adults, BRFSS, 1990
4% 4-6% 6% n/a Source: Mokdad et al., Diabetes Care 2000;23:1278-83 Prevalence of Diabetes among U.S. Adults, BRFSS, 1991-92
4% 4-6% 6% n/a Prevalence of Diabetes among U.S. Adults, BRFSS, 1993-94 Source: Mokdad et al., Diabetes Care 2000;23:1278-83
4% 4-6% 6% n/a Source: Mokdad et al., Diabetes Care 2000;23:1278-83 Prevalence of Diabetes among U.S. Adults, BRFSS, 1995-96
4% 4-6% 6% n/a Source: Mokdad et al., Diabetes Care 2000;23:1278-83 Prevalence of Diabetes among U.S. Adults, BRFSS, 1997-98
Prevalence of Obesity* among U.S. Adults BRFSS, 1985 (*Approximately 30 pounds overweight)
Prevalence of Obesity* among U.S. Adults BRFSS, 1986 (*Approximately 30 pounds overweight)
Prevalence of Obesity* among U.S. Adults BRFSS, 1987 (*Approximately 30 pounds overweight)
Prevalence of Obesity* among U.S. Adults BRFSS, 1988 (*Approximately 30 pounds overweight)
Prevalence of Obesity* among U.S. Adults BRFSS, 1989 (*Approximately 30 pounds overweight)
Prevalence of Obesity* among U.S. Adults BRFSS, 1990 (*Approximately 30 pounds overweight)
Prevalence of Obesity* among U.S. Adults BRFSS, 1991 (*Approximately 30 pounds overweight)
Prevalence of Obesity* among U.S. Adults BRFSS, 1992 (*Approximately 30 pounds overweight)
Prevalence of Obesity* among U.S. Adults BRFSS, 1993 (*Approximately 30 pounds overweight)
Prevalence of Obesity* among U.S. Adults BRFSS, 1994 (*Approximately 30 pounds overweight)
Prevalence of Obesity* among U.S. Adults BRFSS, 1995 (*Approximately 30 pounds overweight)
Prevalence of Obesity* among U.S. Adults BRFSS, 1996 (*Approximately 30 pounds overweight)
Prevalence of Obesity* among U.S. Adults BRFSS, 1997 (*Approximately 30 pounds overweight)
Prevalence of Obesity* among U.S. Adults BRFSS, 1998 (*Approximately 30 pounds overweight)
Prevalence of Obesity* among U.S. Adults BRFSS, 1999 (*Approximately 30 pounds overweight) Source: Mokdad A H, et al. Am Med Assoc 2000;284:13
Changes in the Prevalence of Obesity (BMI > 95th Percentile) Among U.S. Female Children and Adolescents
Consequences of Childhood and Adolescent Obesity Common Uncommon • Growth • Psychosocial • Hyperlipidemia • Hepatic steatosis • Abnormal glucose metabolism • Persistence into adulthood • Hypertension • Sleep apnea • Pseudotumor • PCOD • Cholelithiasis • Orthopedic
Consequences of Adult Obesity • Medical • Polycystic ovary disease • Gall bladder disease • Osteoarthritis • Cancer • Pregnancy and the postpartum • Mortality • Psychosocial • Cardiovascular • Hyperlipidemia • Diabetes mellitus • Hypertension • Respiratory • Cardiac
Type 2 DM CHD Hypertension Gallbladder Breast Ca Endometrial Ca Colon Ca Osteoarthritis Total Annual Direct and Indirect Costs Attributable to Obesity in the United States(Billions of 1995 Dollars) Disease Direct Costs Indirect Costs $32.4 $ 7.0 $ 3.2 $ 2.6 $ 0.8 $ 0.3 $ 1.0 $ 4.3 $51.6 $30.7 $ NA $ NA $ 0.1 $ 1.5 $ 0.5 $ 1.8 $ 12.9 $47.5 Wolf and Colditz, Ob Res 1998;6:97
Factors Related to the Onset of Obesity • Altered dietary intake • Decreased physical activity • Increased inactivity
Shifts in Food Practices in the United States • Fast food consumption • Reduced frequency of family meals • Restrained eating, meal skipping • Consumption of soft drinks - increased from 27 to 44 gal/y from 1972-92 • 30,000 products in supermarkets • 12,000 new food products/year
Factors Related to the Onset of Obesity • Altered dietary intake • Decreased physical activity • Increased inactivity
Modal Travel in Urban Areas: Europe and North America Percent of Trips by Mode Public Country Bicycle Walking Transport Car Netherlands 30 18 5 45 Germany 12 22 16 49 England 8 12 14 62 Italy 5 28 16 42 Canada 1 10 14 74 USA 1 9 3 84 Transportation Quarterly 1997; 51:31
Factors Related to the Onset of Obesity • Altered dietary intake • Decreased physical activity • Increased inactivity
0-1 1-2 2-3 3-4 4-5 5+ Distribution of Hours of TV Per Day:NHES Youth Aged 12-17 in 1967-70 and NLSY Youth Aged 12-17 in 1990 TV Hours (Youth Report)
Prevalence of Obesity by Hours of TV per Day:NHES Youth Aged 12-17 in 1967-70 and NLSY Youth Aged 10-15 in 1990
0 • Exercise -5 -10 • Sedentary -15 -20 -25 0 4 8 12 Effect of Reduced Inactivity or Exercise on Obesity • Percent • Overweight • Change • Time (months) • Epstein et al, Health Psychol 1995; 14:109
Intervention Sites to Prevent or Treat Obesity • Medical Settings • School • Work Site • Community
Prevalence of weight loss advice from a health care provider among obese persons: Did not receive advice 58% Receive advice 42% Galuska DA et al. JAMA 1999
Weight Loss Advice and Self-reported Attempts to Lose Weight(BRFSS, 1996) 57.6% 79.5% Galuska DA et al. JAMA 1999
Intervention Sites to Prevent or Treat Obesity • Medical Settings • School • Work Site • Community
School-based Approaches to Treat or Prevent Obesity • Physical education classes • Media curricula and TV turnoffs • Competitive foods and pouring contracts • Comprehensive school-based interventions
Daily Physical Education Classes in School (9-12th graders) Year 1991 1997 % 42% 27% Source: YRBS
School-based Approaches to Treat or Prevent Obesity • Physical education classes • Media curricula and TV turnoffs • Competitive foods and pouring contracts • Comprehensive school-based interventions
Baseline Intervention Follow-up Effects of Increased Choices and Reduced Price on Fruit and Vegetable Consumption Fruits (#/day) Vegetables (lbs/day) Jeffery et al, Prev Med 1994; 23:788
Effects of the Promotion of Low-fat Items in Vending Machines
School-based Approaches to Treat or Prevent Obesity • Physical education classes • Media curricula and TV turnoffs • Competitive foods and pouring contracts • Comprehensive school-based interventions
Effects of Planet Health on Obesity* Prevalence *BMI and TSF> 85th percentile **p< 0.05
Intervention Sites to Prevent or Treat Obesity • Medical Settings • School • Work Site • Community
Intervention Sites to Prevent or Treat Obesity • Medical Settings • School • Work Site • Community
Community-based Approaches • Communications • Community programs • Environmental change • Sidewalks and bicycle trails • Access • Neighborhood safety • Building design • Urban planning