Download
1 / 41
410 likes | 615 Views
Session IV NOAA - AUXILIARY PARTNERSHIP. NOAA Hydrographic Surveys. Coast Guard Auxiliary Chart Update missions. United States Power Squadrons Co-operative Charting Program. Corps of Engineers Surveys. United States Coast Guard Local Notice to Mariners. Sources of Chart Maintenance.

E N D
NOAA Hydrographic Surveys Coast Guard Auxiliary Chart Update missions. United States Power Squadrons Co-operative Charting Program Corps of Engineers Surveys United States Coast Guard Local Notice to Mariners Sources of Chart Maintenance
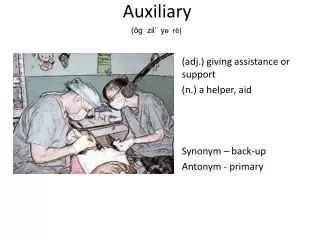
Auxiliary Chart Updating Activities Nautical Chart Corrections. Coast Pilot Reports. Small Craft Facility Reports.
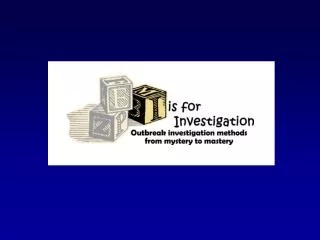
Chart Scene Investigation Act like a CSI investigator . . . • Be Complete– don’t miss any evidence to support your claim. • Be Scientific – take precise measurements. Identify your tools. Identify dates and times. • Be Clear – use concise language. Explain your observations in as few words as possible but still expressing your full meaning and descriptions. • Photograph the scene clearly – document how you took your photos. Make your photos prove your case. • Be prompt. Report in a timely manner. • Submit professional grade reports. CSI
Shoreline Discrepancy on a Va. Beach Observer walked the high water line with a DGPS on Virginia Beach -new shoreline shown in red (max discrepancy 100 yds) Chart 12254 1:20,000
… for reporting wrecks Are visible charted wrecks still visible? If not, what happened to them? If salvaged, by whom and when? Get a copy of the documentation from the salvage company. This is the type of information that is required to get the wreck or obstruction taken off a nautical chart. TIPS
… for chart updating. Charted landmarks should be investigated to insure that they are: Still in existence. Are still useful as landmarks when viewed from seaward. Make recommendations regarding the deletion of charted landmarks and/or the addition of new landmarks. TIPS
… for chart updating. Are charted overhead cables still there? Are there any new overhead obstructions? Rule of Thumb: If an overhead obstruction crosses a waterway where there are soundings shown on a chart, the vertical clearance for the obstruction needs to be shown. TIPS
… for chart updating. Interview other chart users in the area. Dive shops Marinas Charter fishermen Commercial vessel captains. Pilots Solicit local knowledge about: Shoals New obstructions Uncharted wrecks or rocks. TIPS
… for chart updating. PLAN Review your chart for potential discrepancies. Check comparative data in the Light List and the Coast Pilot. All definitions, specifications and narratives must correspond. Plot a course to the discrepancy when you have to move off the main channel. Visit the site and validate that the data on the chart, in the Coast Pilot and Light list corresponds to your observations. Use your camera to prove your point.
… for chart updating. When reviewing your chart systematically and completely. Look for: New features that need to be charted. Features no longer accurate. Cartographic errors. Misspelled geographic names. Wrong colors used for ATONs. Waterfront areas shown on the chart should be compared with existing conditions. Determine whether the chart presents a true picture of the areas as it actually exists. TIPS
… for chart updating. Always verify the information published in the Coast Pilot to what you actually observe on scene. Is the information accurate and complete? Report changes on a 77-5 report Reference: Edition of the Coast Pilot, Page and line number(s) in question. TIPS
(157) Reserved Channel, 0.5 mile northwestward of Castle Island, is a dredged unmarked channel which leads westward from the Boston Main Channel for about 1 mile to nearbydrawbridge. (157) Reserved Channel Line 3 should read: 1 mile to nearby fixed bridge. Coast Pilot report example
Sample Text on 77-5 This information change is for Coast Pilot#1 Atlantic Coast – Eastport to Cape Cod. Page 245, Chart 13272 – Reserve Channel See attached Coast Pilot Text Correction Report for suggestions to change copy.
NOAA form 77-5 Should include: ID Feature – explain what exactly are you doing? List the Latitude and Longitude of the object that you are reporting on. Include the EPE or DOP of each position. Method used to position the object (GPS, DGPS, WAAS). What type and model device was used. Date and time when depths and positions were recorded. Item resolution – what should be done about your observation? Reference when Field Pictures are taken. Attach a marked-up Chart Section.
Credit is awarded upon receipt of: • NOAA Form 77-5. • Copy of chart section showing the item or object being reported. • Any other pertinent documentation. • Submit the info to NOS via NS Chain • Acknowledgement provided via DSO-NS.
Small Craft Facility Reports Include a copy of chart section for all applicable submissions • Gives a quick location reference of item. • Include all possible information about nearby attractions and accommodations. • Attach business cards & brochures. • Include a marked chart section of Facility.
1980 2001 2 1 1 2 3 3 4 4 8 5 6 5 8 6 7 3 3 7 • Submerged Piles Moved • Lighthouse and bridges added • New Marina • Most depths in harbor changed • Major changes in shoreline, marina added • Federal project channels discontinued • Lighted tower added • Cultural features suppressed Baltimore Inner Harbor Changes from 1980 to 2001.
Using As-built Drawings Tracing made of new marina using field geo-referenced as-built drawing As-built drawing layer removed to show chart correction
Using As-Built Drawings Geo-referenced As-Built Drawing Transferred to the Chart
Although Pier Has been Reported Removed NOAA must chart as “ruins” New Chart Old Chart
Visible Wreck Not Found Old Chart New Chart Report Wreck Removed
Example of a good NOAA Chart Update The following chart update was submitted in 2009 for an uncharted FAA Doppler radar tower on Floyd Bennett Field, Brooklyn. This is an example of a chart update report that NOAA said was a good one.
Example of a Chart Update report that NOAA thought was good.
The Result: NOAA added the radar tower to the chart!
END OF SESSION IX