Download
1 / 42
420 likes | 511 Views
Loss in state-owned assets and the gap between the rich and the poor liu fengyi School of Economics, nankai university,Tianjin , China. 1.Introduction 2.Literature 3.Specific evidence 4.Conclusion. 1.Introduction.

E N D
Loss in state-owned assets and the gap between the rich and the poor • liu fengyi • School of Economics, nankai university,Tianjin , China
1.Introduction • 2.Literature • 3.Specific evidence • 4.Conclusion
1.1 The reform of state-owned enterprises affects income distribution system • In china, The reform of state-owned enterprises is called the central link of China's economic system. This means that the reform of state-owned enterprise is the key of the reform of China. The reform of state-owned enterprise changes the old production relations. The state-owned property decreased constantly and private property is increasing relevantly. This must affect income distribution system.
1.2 The reform of state-owned enterprise causes the great loss of state assets. • The reform of state-owned enterprise was the reform of contract and responsibility system in the 1980s to the joint-stock enterprise in the 1990s. Along with the deepening of reform, the increasingly conspicuous problem is the great loss of state assets.
1.2 The reform of state-owned enterprise causes the great loss of state assets. • According to calculation, the annual loss of state assets in 1980s was 50 billion Yuan. Since the 1990s, the annual loss of state assets was close to 100 billion Yuan. There might be a loss of 1/100 if calculated by 1 billion state assets in 2005.This caused strong repercussions in China.
1.3 There are several kinds of the loss of state assets • There are several kinds of the loss of state assets. For example, some managers of state-owned enterprises use “handle rights” to change the state assets into private income. Some deprive the state assets in name of the reform of joint-stock.
1.3 There are several kinds of the loss of state assets • Some use the MBO form to buy the state assets under the normal price. A great quantity of the state assets becomes private property. • It is servied that the price of the state assets was underestimated about 10% in public auction, while the price of the state assets was underestimated about 30% in privately transaction.
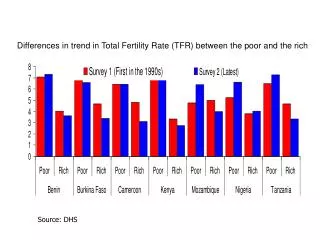
1.4 The gap between poor and rich is serious • UNDP believes that the current Gini coefficient of China is 0.45. The poverty-stricken people who accounted for 20% of the population own only 4.7% of the income and consumption, while the richest people who accounted for 20% of the total population hold as high as 50%.
1.4 The gap between poor and rich is serious • It is obvious to note that the gap between rich and poor has already broken the reasonable limitation, and the Chinese government has also realized the seriousness of the problem. Therefore, the direction of central government thinking is focused on narrowing the gap between the rich and the poor and emphasizing social fairness and social justice and social harmony since 2003.
2.1 The opinion of the new liberalism • There are two kinds of opinion about the loss of state assets among the theorists in China. One is the theory of the new liberalism , especial, the property rights of The New Institutional school. the theory of the economists of new liberalism who believe the power of market. They hold that public ownership and market economy are incompatible to each other. The root of the loss in national assets is indistinct property.
2.1 The opinion of the new liberalism • SO they advocate that privatization is the only solution. • Some theorists in China who believes in The New Institutional School denied the fact that the state assets were lost. They think that selling state-owned enterprises were only changed the form of national assets. It can benefit the market efficiency.
2.1 The opinion of the new liberalism • They also denied that the loss of national assets aggravates the disparity between poor and rich. • (representative figure: • Zhang weiying 1995,2004; Zhou qiren,1999,2003; Yao yang,2004; • Fan gang 1998,2004; Wu jinglian 2004,2005)
2.2 The opinion of the marxism economics • Marxism economics has important position in China. It is official economics. The other opinion belongs the economists of marxism. They hold that a great quantity of the national assets were changing private ownership.
2.2 The opinion of the marxism economics • The reason of the loss of state assets is not because State-owned enterprises fail to gear up themselves to the market economy but because the system of state-owned assets is lack of order. The solution is the reform of the management system of state-owned assets, not privatization.
(representative figure: Cheng enfu 1998,2000,2004; Zuo dapei, 2001, 2004, 2005;Meng jie 2004; Bai baoli 2004.Wu yifeng, 2003;Ding bing 1999.)
Chinese central government is inclined to the marxism opinion, and central government formulated many policies to forbid the loss of national assets from 1998 to today. But the local officials were willing to accept the theory of the new liberalism. So the central government advocated to criticize the new liberalism economics.
3.specific evidence • The difficult point about my topic: we can’t research for the substantial directly data about the loss of state assets. So I have to analyse the relations between the loss of state assets and the income in town of China indirectly.
3.1 The quantities of state-owned enterprise change (chart 1) state-owned collective others
500000 400000 300000 200000 total others 100000 collective Stae_owned 0 1957 1978 1982 1986 1990 1994 1998 2002 1965 1980 1984 1988 1992 1996 2000 . Äê·Ý
It was a key year about the reform of state-owned enterprises in 1997 .There are two reasons: one was that the state-owned enterprises met the most difficult in reform, the national assets became net loss, it never appeared before. the other was that the fifteenth mission of chinese communist party was held, the central government permit
to sell small state-owned enterprises while necessary. So the local governments sale the national assets since 1997 rapidly, and the private property increased relevantly.
The workers in state-owned enterprises met severe challenge at that time. their income decreased rapidly.
3.3 The state-owned enterprises hold the ratio of the low income group
Data source: • 1.Ministry of labour and social security.prc. • 2.Li peilin.Socal stratification in chinese today.2004,p86.
年份 国家总量 国家发展速度 国家全民 全民发展速度 国家集体 集体发展速度 国家其他 其他发展速度 1978 348400 1 83700 1.0000 264700 1.0000 0 1 1979 355000 1.0189 83800 1.0012 271200 1.0246 0 0.0000 1980 376900 1.0617 83400 0.9952 293500 1.0822 400 1.0000 1981 381000 1.0109 84200 1.0096 296800 1.0112 500 1.2500 1982 387900 1.0181 86000 1.0214 301900 1.0172 700 1.4000 1983 391700 1.0098 87100 1.0128 304600 1.0089 800 1.1429 1984 436200 1.1136 84100 0.9656 352100 1.1559 1000 1.2500 1985 246100 0.5642 93700 1.1141 150700 0.4280 1700 1.7000 1986 253300 1.0293 96800 1.0331 154100 1.0226 2400 1.4118 1987 255700 1.0095 97600 1.0083 154200 1.0006 3900 1.6250 1988 262200 1.0254 99100 1.0154 157700 1.0227 5400 1.3846 1989 271100 1.0339 102300 1.0323 161600 1.0247 7200 1.3333 1990 275600 1.0166 104400 1.0205 162400 1.0050 8800 1.2222 1991 274400 0.9956 104700 1.0029 158900 0.9784 10800 1.2273 1992 272500 0.9931 103300 0.9866 155000 0.9755 14200 1.3148 1993 309100 1.1343 104700 1.0136 172300 1.1116 32100 2.2606 1994 314100 1.0162 102200 0.9761 167400 0.9716 44500 1.3863 1995 363000 1.1557 118000 1.1546 184700 1.1033 60300 1.3551 1996 376500 1.0372 113800 0.9644 192500 1.0422 70200 1.1642 1997 334300 0.8879 98600 0.8664 158400 0.8229 77300 1.1011 1998 165080 0.4938 64737 0.6566 47745 0.3014 52598 0.6804 1999 162033 0.9815 61301 0.9469 42585 0.8919 58147 1.1055 2000 162885 1.0053 53489 0.8726 37841 0.8886 71555 1.2306 2001 171256 1.0514 46767 0.8743 31018 0.8197 93471 1.3063 2002 181527 1.0600 41125 0.8794 27447 0.8849 112955 1.2084 2003 196222 1.0810 34280 0.8336 22478 0.8190 139464 1.2347 平均发展速度 0.9742 0.9719 0.9133 1.2781
年份 国家总量增长速度 全民增长速度 集体增长速度 其他增长速度 1978 0 0 0 1979 0.018943743 0.0012 0.0246 1980 0.061690141 -0.0048 0.0822 0 1981 0.010878217 0.0096 0.0112 0.25 1982 0.018110236 0.0214 0.0172 0.4 1983 0.009796339 0.0128 0.0089 0.1429 1984 0.113607353 -0.0344 0.1559 0.25 1985 -0.435809262 0.1141 -0.572 0.7 1986 0.0292564 0.0331 0.0226 0.4118 1987 0.009474931 0.0083 0.0006 0.625 1988 0.025420415 0.0154 0.0227 0.3846 1989 0.033943555 0.0323 0.0247 0.3333 1990 0.016599041 0.0205 0.005 0.2222 1991 -0.004354136 0.0029 -0.0216 0.2273 1992 -0.006924198 -0.0134 -0.0245 0.3148 1993 0.134311927 0.0136 0.1116 1.2606 1994 0.016175995 -0.0239 -0.0284 0.3863 1995 0.155682904 0.1546 0.1033 0.3551 1996 0.037190083 -0.0356 0.0422 0.1642 1997 -0.112084993 -0.1336 -0.1771 0.1011 1998 -0.506192043 -0.3434 -0.6986 -0.3196 1999 -0.018457717 -0.0531 -0.1081 0.1055 2000 0.005258188 -0.1274 -0.1114 0.2306 2001 0.051392086 -0.1257 -0.1803 0.3063 2002 0.059974541 -0.1206 -0.1151 0.2084 2003 0.080952145 -0.1664 -0.181 0.2347 年平均增长速度 -0.025740782 -0.0280 -0.0867 0.2781
Data source: • www.earm.cn • Cao putting in order.
4.Conclusion • 4.1 The loss of state assets must inevitably results in the polarity between rich and poor. One extreme is the embezzlement of the state assets. They actually become capitalists; the other extreme is the workers in the original state-owned enterprises who had come down to physical labor.
Under the condition of excessive supply of labour force in china, their wage has been screwed down to a very low level. What is worse, many workers who have made great contributions to the accumulation of capital in state-owned enterprises become unemployment in the process of reform. They have to survive on a minimum standard of living with the subsistence of security.
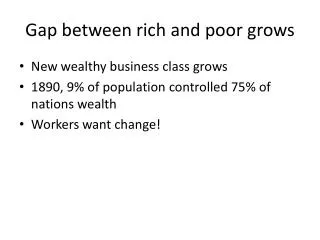
Before the reform and opening up, the state-owned economy accounted for 90%, while the collective economy accounted for 5%,there was only a 5% of the private sector of the economy. However, 20 years after the reform, the ownership of state-owned capital occupies a percentage of only 26, whereas ownership of private capital rises to 56%. The rest goes to collective economy and foreign enterprise.
It is obvious that in the wax and wane of the two economic sectors, private ownership takes up a large proportion. We may say the loss of state assets is the important reason for the disparities in wealth.
4.2 This paper holds the idea that privatization is not only unable to solve the efficiency of the enterprises, but also likely to widen the disparities in wealth. On the other hand, strengthening the management of state assets can not only bring the advantage of public ownership into full play, but overcome all the ill effects of privatization.