Download
1 / 40
400 likes | 499 Views
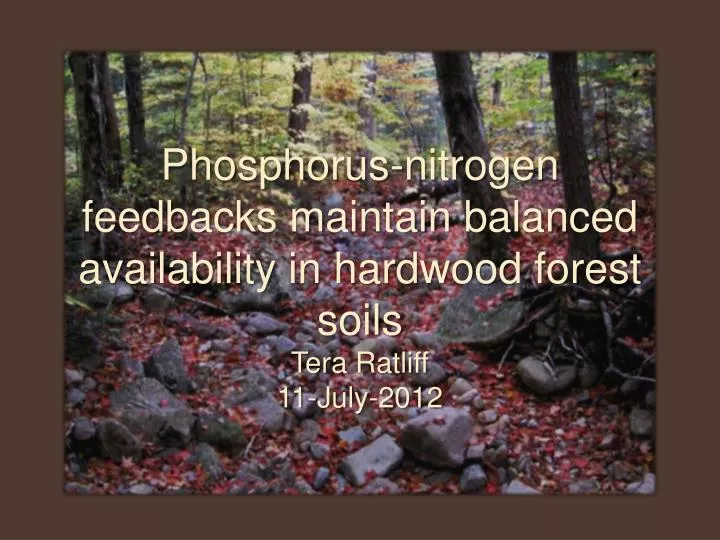
Phosphorus-nitrogen feedbacks maintain balanced availability in hardwood forest soils Tera Ratliff 11-July-2012. US Forest Service. Identifying the processes underlying limitations to productivity help us understand forest ecosystem response to change. Walker and Syers , 1976.

E N D
Phosphorus-nitrogen feedbacks maintain balanced availability in hardwood forest soils Tera Ratliff11-July-2012
US Forest Service Identifying the processes underlying limitations to productivity help us understand forest ecosystem response to change Walker and Syers, 1976 Total Soil Nutrients Time (millions of years)
Resource optimization in response to N and P fertilization Response Ratio = Mean outcome of treatment: mean outcome of control • When N is high, organisms allocate to P • Do N and P equilibrate over the long-term? Marklein and Houlton, 2011
Pretreatment (2008 to 2009) soil collection MELNHE plots • Cores divided into Oe and Oa • Resin strips buried in-situ (2010) C9 -1-A PO4-
N and P availability covary in forests of varying ages in the northern hardwoods • N availability appears to promote P availability via phosphatase production.
Conclusions • Tight coupling of N and P could contribute to colimitation at the ecosystem level • Resource optimization could work to prevent P-limitation in the short-term by increasing investment when N is high • Mechanisms of P redistribution from slowly available pools are of interest for understanding long-term effects of anthropogenic changes in N and P availability
Acknowledgments Many people have helped in carrying out this project, so many thanks to KevanMinick, Mark Dempsey, Brittany Coyne, Stephanie Bailey, Carrie Rose Levine, members of the Fisk Lab, and collaborators at HBEF for assistance in the field and laboratory. Questions?
The grass is always greener (than the forest): is it the N? Hannah Tremblay Carleton College, 2014
Background • Fertilization and fossil fuels have more than doubled amount of available N in biosphere • Expansion of suburbs is one of the fastest growing land uses • Recent evidence suggests that urban soils may be a sink for atmospheric N (Raciti et al. 2008)
The experiment • To quantify the differences in total soil nitrogen, available nitrate, and nitrification rates between residential lawns and forested areas in northern New Hampshire. • How does the land use shift from forests to lawns affect nitrification and mineralization rates?
Methods: site selection • 12 clusters • 58 sites • Personal interview and questionnaire
Methods:In the field • 5 volumetric, 5.8cm diameter, 15cm deep cores from lawns and adjacent forests • Vegetative cover and tree inventory recorded • Measured area of property
Methods: In the lab • Soil sieved and homogenized • Two 20 gram subsamples • “Time 0” extraction: placed in a 250 ml Nalgene bottle with 100ml of 2M KCl. Settled for 24 hours. • “Time final” extraction: incubated for 21 days in a 1 pint mason jar and fanned every 3 days. • Soil samples filtered and analyzed
Results P-value < .05
Moving forward • Nitrification and mineralization rates • Investigation of historical land use • Relationship with vegetation • Demographic information
Thank you • Craig See • Adam Wild • Clarissa Lyons • Austin McDonald • ShinjiniGoswami • Russell Auwae • Ruth Yanai • Melany Fisk • Tim Fahey • Paul Lilly • Peter Groffman • Paige Warren • Matt Vadeboncoeur
References • Raciti SM, Groffman PM, Fahey TJ. 2008. Nitrogen retention in urban lawns and forests. Ecol Appl 18(7):1615–26.
The Bartlett Baby Boom: An Inventory of Germinants Following a Mast Year AlaniGrace Grant New York University 2012
MOTIVATION • Over the last three decades, sugar maple has declined in the northern hardwood forests • At the same time, American beech has increased • Hane (2003) has linked sugar maple decline to an increase of understory beech due to BBD
HYPOTHESES • There will be a greater amount of beech germinants than sugar maple germinants present in older stands • Sugar maple decline is related to increased presence of beech saplings • Beech Bark Disease positively influences mast seed production
Acer saccharum Fagusgrandifolia Photographs courtesy of Matt Vadeboncoeur
Germinant Abundance Correlates with Adult Abundance in Sugar Maple and Beech
Lower Sugar Maple Germinant Abundance in Stands With More Beech Saplings
Next Steps • Revisit sites and count surviving germinants • Compare survival by species • Examine effect of fertilizer on germinant survival
Ruth Yanai – SUNY-ESF • Shinjini Goswami – Miami University • Matt Vadeboncoeur – UNH • Kikang Bae – SUNY-ESF • Shoestring Summer Crew Members
Selected References • DiGregorio, L; Krasny, M; Fahey, T. (1999). Radial Growth Trends of Sugar Maple (Acer saccharum) in an Allegheny Northern Hardwood Forest Affected by Beech Bark Disease. Journal of the Torrey Botanical Society, 245-254. • Hane, E. (2002). Indirect effects of beech bark disease on sugar maple seedling survival. Canadian Journal of Forest Research, 807-813. • Horsley, S;Long, R; Bailey, S;Hallett, R;Wargo, P. (2002). Health of Eastern North American Sugar Maple Forests and Factors Affecting Decline. Northern Journal of Applied Forestry, 34-44. • Juice, S;Fahey, T;Siccama, T; Denny, E;Eagar, C et al. (2006). Response of sugar maple to calcium addition to northern hardwood FOREST. Ecology, 1267-1280. • United States Department of Agriculture. (1990). Silvics of North America. Washington, , D.C.: U.S. Department of Agriculture.
QUANTIFYING UNCERTAINTY IN ECOSYSTEM STUDIES Ruth Yanai, Carrie Rose Levine, Craig See (SUNY-ESF) John Campbell, Mark Green (USFS and PSU) Amey Bailey, Stephanie Laseter (USFS)
Gaps in the Precipitation Record at Sevilleta 20 collectors across SEV from 1989-1995 Solutes: NO3, NH4, SO4, Cl, Na, K, Ca, Mg, and PO4 Collections monthly or after heavy rains
Gaps in the Streamflow Record Hubbard Brook Coweeta
Gaps in the Streamflow Record (days) Hubbard Brook Coweeta
Uncertainty in change over time in sulfate in atmospheric deposition in NY as a function of sampling intensity (21 stations = 100%)
Uncertainty in change over time in Adirondack lake nitrate as a function of sampling intensity (50 lakes monthly = 100%)
Uncertainty in Forest Biomass in W6 as a function of the number of plots sampled
Uncertainty in Change over Time in Forest Biomass in W6
Variation over space and time in stream loads at Hubbard Brook, Coweeta, and Wakayama (Japan)