Download
1 / 1
10 likes | 95 Views
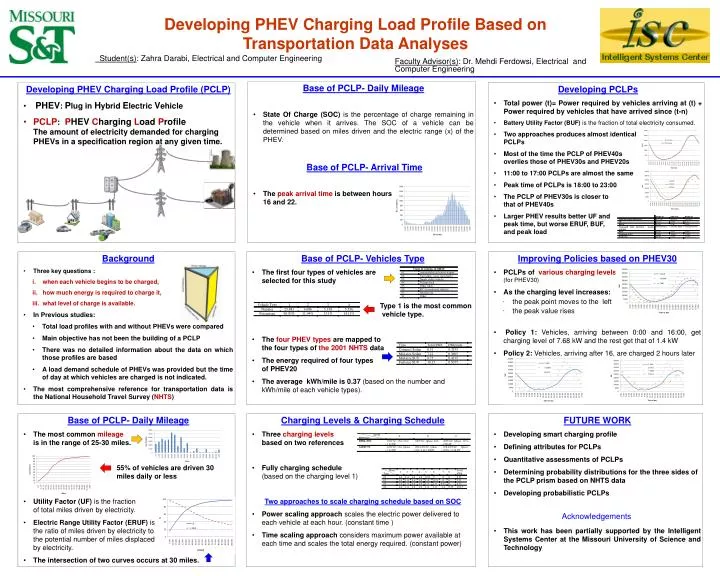
Developing PHEV Charging Load Profile Based on Transportation Data Analyses. Student(s) : Zahra Darabi, Electrical and Computer Engineering. Faculty Advisor(s) : Dr. Mehdi Ferdowsi, Electrical and Computer Engineering. Base of PCLP- Daily Mileage

E N D
Developing PHEV Charging Load Profile Based on Transportation Data Analyses Student(s): Zahra Darabi, Electrical and Computer Engineering Faculty Advisor(s): Dr. Mehdi Ferdowsi, Electrical and Computer Engineering • Base of PCLP- Daily Mileage • State Of Charge (SOC) is the percentage of charge remaining in the vehicle when it arrives. The SOC of a vehicle can be determined based on miles driven and the electric range (x) of the PHEV. • Base of PCLP- Arrival Time • The peak arrival time is between hours 16 and 22. • Developing PCLPs • Total power (t)= Power required by vehicles arriving at (t) + Power required by vehicles that have arrived since (t-n) • Battery Utility Factor (BUF) is the fraction of total electricity consumed. • Two approaches produces almost identical PCLPs • Most of the time the PCLP of PHEV40s overlies those of PHEV30s and PHEV20s • 11:00 to 17:00 PCLPs are almost the same • Peak time of PCLPs is 18:00 to 23:00 • The PCLP of PHEV30s is closer to that of PHEV40s • Larger PHEV results better UF and peak time, but worse ERUF, BUF, and peak load • Developing PHEV Charging Load Profile (PCLP) • PHEV: Plug in Hybrid Electric Vehicle • PCLP:PHEV Charging Load Profile The amount of electricity demanded for charging PHEVs in a specification region at any given time. • Background • Three key questions : • when each vehicle begins to be charged, • how much energy is required to charge it, • what level of charge is available. • In Previous studies: • Total load profiles with and without PHEVs were compared • Main objective has not been the building of a PCLP • There was no detailed information about the data on which those profiles are based • A load demand schedule of PHEVs was provided but the time of day at which vehicles are charged is not indicated. • The most comprehensive reference for transportation data is the National Household Travel Survey (NHTS) • Base of PCLP- Vehicles Type • The first four types of vehicles are selected for this study • Type 1 is the most common is vehicle type. are • The four PHEV types are mapped to the four types of the 2001 NHTS data • The energy required of four types of PHEV20 • The average kWh/mile is 0.37 (based on the number and kWh/mile of each vehicle types). • Improving Policies based on PHEV30 • PCLPs of various charging levels(for PHEV30) • As the charging level increases: • the peak point moves to the left • the peak value rises • Policy 1: Vehicles, arriving between 0:00 and 16:00, get charging level of 7.68 kW and the rest get that of 1.4 kW • Policy 2: Vehicles, arriving after 16, are charged 2 hours later • Base of PCLP- Daily Mileage • The most common mileage is in the range of 25-30 miles. • 55% of vehicles are driven 30 30 miles daily or less • Utility Factor (UF) is the fraction of total miles driven by electricity. • Electric Range Utility Factor (ERUF) is the ratio of miles driven by electricity to the potential number of miles displaced by electricity. • The intersection of two curves occurs at 30 miles. • Charging Levels & Charging Schedule • Three charging levels based on two references • Fully charging schedule (based on the charging level 1) • Two approaches to scale charging schedule based on SOC • Power scalingapproach scales the electric power delivered to each vehicle at each hour. (constant time ) • Time scaling approach considers maximum power available at each time and scales the total energy required.(constant power) • FUTURE WORK • Developing smart charging profile • Defining attributes for PCLPs • Quantitative assessments of PCLPs • Determining probability distributions for the three sides of the PCLP prism based on NHTS data • Developing probabilistic PCLPs • This work has been partially supported by the Intelligent Systems Center at the Missouri University of Science and Technology Acknowledgements