Download
1 / 19
190 likes | 854 Views
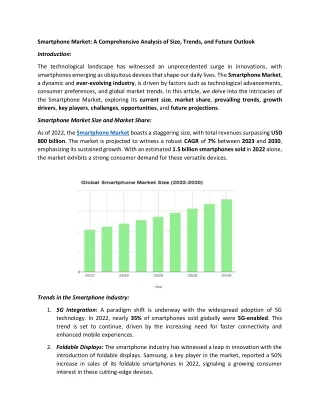
The concept behind the Smartphone App Market Monitor: /n1.This first version of the Smartphone App Market Monitor acts as a comprehensive source of information on the smartphone app market 2.By using, comparing and evaluating different sources for e.g. the user behavior the “Smartphone App Market Monitor” provides you with a range analyses and surveys which have been executed for a specific topic. This should enable any app publisher to get a detailed view on the market and enable informed business decisions 3.The smartphone app market show a dynamic which was not seen before in the mobile world. Therefore the market monitor will be updated and extended every quarter. 4.The market monitor is designed to support your internal discussions and business decisions. Therefore all content is presented in graphs and tables not in long text passages. In addition all graphs and tables can be also downloaded as a PowerPoint for easy usage in your presentations. 5.All facts are presented in graphs and tables to make a key tool for any app publisher, app developer, app store and platform owner /nGlobal smartphone market (penetration, market shares and regions) Smartphone share of global mobile device shipments (1Q07 to 4Q10) Smartphone penetration by country Smartphone operating systems’ market share by shipments in 2009-2010 Number of smartphones shipped per platform 2008-2010 Smartphone platforms’ market share of in-app and mobile web add impressions in 2008-2010 Global platform shares by ownership and activity (mobile web browsing and add impressions) Smartphone penetration and platform shares by region as of 2010 (based on activity defined as mobile web browsing and ad impressions) /nSmartphone user demographics and platform preferences Smartphone users by gender and age Smartphone users by gender and platform Smartphone users by age and platform New-buyers device preferences Smartphone owners’ satisfaction with their OS /nSmartphone application downloads and usage Share of mobile/smartphone subscribers who used downloaded applications Time spent on apps by gender and age Average number of application user has downloaded on smartphone 2008-2010 Number of applications downloaded during life of phone Application performance: comparison of usage loyalty and downloads (per category) Main app discovery metods/nApp store comparison (key trends and figures) Application stores classification (EoY 2010) Store comparison: OEM Application Stores (Key Facts) Store comparison: OEM Application Stores (Key Figures) (EoY 2010) Store Comparison: OS Application Stores (Key Facts) Store comparison: OS Application Stores (Key Figures) (EoY 2010) Store comparison: MNO Application Stores (Key Facts) Store comparison: MNO Application Stores (Key Figures) (EoY 2010) Store comparison: Full-Catalogue Independent Stores (Key Facts) Store comparison: Full-catalogue Independent Stores (Key Figures) (EoY 2010) Publisher Revenue Share in Major Application Stores /nPlatform business potential for app developers Business potential of mobile app platforms based on results of global application developer survey Mobile app platforms for which publishers are developing/plan to develop Number of applications per platform 7/08 to 11/2010 Change in number of apps during 2010 New-adds of applications per platform 3Q/09 to 4Q/10 Average cumulated application downloads per application Store (EOY 2010) Share of total apps and top100 apps by category (Apple App Store) (EoY 2010) Share of total apps and top100 apps by category (Android Market) (EoY 2010) Share of total apps and top100 apps by category (BlackBerry AppWorld) (EoY 2010) Share of total apps and top100 apps by category (Ovi Store) (EoY 2010) Share of total apps and top100 apps by category (Windows Marketplace for Mobile) (EoY 2010) Share of total apps and top100 apps by category (Palm App Catalog)/nSmartphone application market: current status and forecast Smartphone application store launches in 2007-2010 Number of smartphone application Stores (2007 – 2010) Number of applications published on market places (2007-2010) Application store shares of total application downloads EOY 2010 Change in average paid application price per platform during 2010 Smartphone applications market size (2007-2010). Growth of application downloads number (paid and free) and installed base of application shoppers (2007-2010)

E N D
Smartphone App Market Monitor Stay updated Day of update: 22th of February 2011 Version 1 Preview only: Download full report here: http://www.research2guidance.com/shop/index.php/smartphone-app-market-monitor
The concept behind the “Smartphone App Market Monitor” • This first version of the „Smartphone App Market Monitor“ acts as a comprehensive source of information on the smartphone app market • By using, comparing and evaluating different sources for e.g. the user behavior the “Smartphone App Market Monitor” provides you with a range analyses and surveys which have been executed for a specific topic. This should enable any app publisher to get a detailed view on the market and enable informed business decisions • The smartphone app market show a dynamic which was not seen before in the mobile world. Therefore the market monitor will be updated and extended every quarter. • The market monitor is designed to support your internal discussions and business decisions. Therefore all content is presented in graphs and tables not in long text passages. In addition all graphs and tables can be also downloaded as a PowerPoint for easy usage in your presentations. • All facts are presented in graphs and tables to make a key tool for any app publisher, app developer, app store and platform owner Preview only. Download full report here: http://www.research2guidance.com/shop/index.php/smartphone-app-market-monitor
Contents (1/3) Global smartphone market (penetration, market shares and regions) Smartphone share of global mobile device shipments (1Q07 to 4Q10) Smartphone penetration by country Smartphone operating systems’ market share by shipments in 2009-2010 Number of smartphones shipped per platform 2008-2010 Smartphone platforms’ market share of in-app and mobile web add impressions in 2008-2010 Global platform shares by ownership and activity (mobile web browsing and add impressions) Smartphone penetration and platform shares by region as of 2010 (based on activity defined as mobile web browsing and ad impressions) Smartphone user demographics and platform preferences Smartphone users by gender and age Smartphone users by gender and platform Smartphone users by age and platform New-buyers device preferences Smartphone owners’ satisfaction with their OS Smartphone application downloads and usage Share of mobile/smartphone subscribers who used downloaded applications Time spent on apps by gender and age Average number of application user has downloaded on smartphone 2008-2010 Number of applications downloaded during life of phone Application performance: comparison of usage loyalty and downloads (per category) Main app discovery metods Preview only. Download full report here: http://www.research2guidance.com/shop/index.php/smartphone-app-market-monitor
Contents (2/3) App store comparison (key trends and figures) Application stores classification (EoY 2010) Store comparison: OEM Application Stores (Key Facts) Store comparison: OEM Application Stores (Key Figures) (EoY 2010) Store Comparison: OS Application Stores (Key Facts) Store comparison: OS Application Stores (Key Figures) (EoY 2010) Store comparison: MNO Application Stores (Key Facts) Store comparison: MNO Application Stores (Key Figures) (EoY 2010) Store comparison: Full-Catalogue Independent Stores (Key Facts) Store comparison: Full-catalogue Independent Stores (Key Figures) (EoY 2010) Publisher Revenue Share in Major Application Stores Platform business potential for app developers Business potential of mobile app platforms based on results of global application developer survey Mobile app platforms for which publishers are developing/plan to develop Number of applications per platform 7/08 to 11/2010 Change in number of apps during 2010 New-adds of applications per platform 3Q/09 to 4Q/10 Average cumulated application downloads per application Store (EOY 2010) Share of total apps and top100 apps by category (Apple App Store) (EoY 2010) Share of total apps and top100 apps by category (Android Market) (EoY 2010) Share of total apps and top100 apps by category (BlackBerry AppWorld) (EoY 2010) Share of total apps and top100 apps by category (Ovi Store) (EoY 2010) Share of total apps and top100 apps by category (Windows Marketplace for Mobile) (EoY 2010) Share of total apps and top100 apps by category (Palm App Catalog) Preview only. Download full report here: http://www.research2guidance.com/shop/index.php/smartphone-app-market-monitor
Contents (3/3) Smartphone application market: current status and forecast Smartphone application store launches in 2007-2010 Number of smartphone application Stores (2007 – 2010) Number of applications published on market places (2007-2010) Application store shares of total application downloads EOY 2010 Change in average paid application price per platform during 2010 Smartphone applications market size (2007-2010). Growth of application downloads number (paid and free) and installed base of application shoppers (2007-2010) Hereby we provide some previews of the slides you will find in the report. The information shown is limited. Please purchase for full content. Preview only. Download full report here: http://www.research2guidance.com/shop/index.php/smartphone-app-market-monitor
Some countries have a smartphone penetration of more than xx% Smartphone penetration by country Preview only. Download full report here: http://www.research2guidance.com/shop/index.php/smartphone-app-market-monitor Note eMarketer numbers are estimates based on various sources, whereas comScore, Nielsen, Exact Target, Initiative and mobileSQUARED are survey results, therefore we see significant differences in estimates. Sources: [1] comScore (i), [3] The Nielsen Company (i, v, vii), [4] eMarketer, [6] Initiative, [11] mobileSQUARED (ii), [12] ExactTarget, [14] Telenor, [15]Reuters (TAC), [16] TeliaSonera, [17] Adzookie
Smartphone market: Newcomers Apple and Android won almost xx% market share in only two years Smartphone operating systems’ market share by shipments in 2009-2010 Preview only. Download full report here: http://www.research2guidance.com/shop/index.php/smartphone-app-market-monitor Source: [2] Gartner
Smartphone ownership and activity market share vary significantly between platforms Global platform shares by ownership and activity (mobile web browsing and add impressions) Activity Ownership Preview only. Download full report here: http://www.research2guidance.com/shop/index.php/smartphone-app-market-monitor Sources: [1] comScore (i), [18] AdMob, [19] inMobi, [22] GlobalStats, [20] Canalys, [2] Gartner, [21] IDC
Smartphone platform market shares per region Platform shares by region as of 2010 (based on activity defined as mobile web browsing and ad impressions) Preview only. Download full report here: http://www.research2guidance.com/shop/index.php/smartphone-app-market-monitor Sources: AdMob
A typical smartphone user is a xx year old man Smartphone users by gender Smartphone users by age Preview only. Download full report here: http://www.research2guidance.com/shop/index.php/smartphone-app-market-monitor Sources: [1] comScore (ii), [3] The Nielsen Company (viii), [24] Yates.com, [12] Exact Target, [19] IHL Group
Smartphone owners are xx times more active app users compared to the average Share of total mobile subscribers who used a downloaded application Share of smartphone owners who used a downloaded application Factor x5 Preview only. Download full report here: http://www.research2guidance.com/shop/index.php/smartphone-app-market-monitor Sources: [1] comScoreInc, [3] The Nielsen Company (I, v, vi)
Average number of application user has downloaded on smartphone 2008-2010 Average number of application user has downloaded on smartphone 2008-2010 Preview only. Download full report here: http://www.research2guidance.com/shop/index.php/smartphone-app-market-monitor Sources: [3] The Nielsen Company (ii, vi). [5] Compete (i), [6] Initiative, [7] MobClix (ii,iii), [9] GFI Group
App comparison: usage loyalty versus download popularity App loyalty vs. downloads (per category) Preview only. Download full report here: http://www.research2guidance.com/shop/index.php/smartphone-app-market-monitor * Popularity is determined by share of users who claim to have downloaded an application from a category. ** Loyalty is defined as share of users who still used an application 90 days after downloading it. Sources: [5] Compete, Smartphone Intelligence, Q3 2008. [8] Flurry Smartphone Industry Pulse, Q3 2009
Store comparison: OEM Application Stores (Key Facts) a Store operator – Handmark Preview only. Download full report here: http://www.research2guidance.com/shop/index.php/smartphone-app-market-monitor X $
Change in Number of Apps in 14 major app stores during 2010 Change in Number of Apps during 2010 Average growth of apps per store Growth rate of apps per store Absolute growth of apps per store Preview only. Download full report here: http://www.research2guidance.com/shop/index.php/smartphone-app-market-monitor As of December 2010. Source: research2guidance
Apple App Store: Competition level per app category Share of total apps and top100 apps by category on Apple App Store (EoY 2010) +xx% +xx% Fastest growing categories in 2010 Preview only. Download full report here: http://www.research2guidance.com/shop/index.php/smartphone-app-market-monitor Comment: Games comprise 66% of top 200 apps and are not included in this comparison. Source: research2guidance, distimo
Change in Average Paid Application Price per Platform during 2010 Change in Average Paid Application Price per Platform during 2010 Preview only. Download full report here: http://www.research2guidance.com/shop/index.php/smartphone-app-market-monitor Average price calculation per platform is based on the following stores: Apple App Store, BlackBerry App World, Android Market, Windows Marketplace, Nokia Ovi Store, Palm App Catalog, Handango, MobiHand, PocketGear, Handmark, Handango, and other. Source: research2guidance
The addressable market for apps reached xxx million users in 2010 Growth of Application Downloads Number (Paid and Free) and Installed Base of Application Shoppers (2007-2010) Installed User Base (in millions) Total Downloads of Free and Paid Apps (in millions) Preview only. Download full report here: http://www.research2guidance.com/shop/index.php/smartphone-app-market-monitor Source: research2guidance.
research2guidance: get in contact Reports and PowerPoint slide-sets market insights on selected topics Bespoke research custom-made research for your individual needs Knowledge center a subscription to a wealth of data, analysis, profiles, and daily news and opinion Consulting services projects tailored to assist you in developing your mobile strategy A one-on-one expert call with a research analyst for • A personal 15-30 min. consultation • Questions and answers about our research • Matching your needs with our research services Write an email to expert@research2guidance.com Direct web-shop access to our reports and PPTs • Browse our research products • Download immediately • Easy payment (VISA; Master Card; PayPal) Visit www.research2guidance.com/shop Additional information on • Pricing • Report Packages • Custom made services and bespoke projects Call+49 (0)30 609893366 Our Service Offerings Contact us for Preview only. Download full report here: http://www.research2guidance.com/shop/index.php/smartphone-app-market-monitor