Download
1 / 26

E N D
Health CareersBeyond the Headcount OKAHEC Center for Rural HealthOklahoma State University - Center for Health Sciences National AHEC Conference Las Vegas, NV
Careers Programming • Awareness -A brief introduction to the array of health professions -Counted in aggregate • Exploration -In depth experiences to expose student directly to health careers and assist them in academic career -Students registered and individual activities documented
Documentation of Program Activity • Contract work plans reflect general output goals • Data reported monthly to the program office (used for education, program evaluation and development, and reporting for state, fed, university) • Entered into statewide database • Quarterly reports generated for centers (Ethnic breakdown, students, hours, activities by level)
% of staff time spent on evaluation and documentation • Staff time devoted to documentation of program activities was estimated at a total of 2.85 FTE (statewide) • Equal to 12% of total staff in the state • Equal to $137,690 in salary and benefits statewide per year • All programs, not just Careers
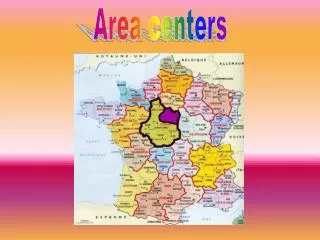
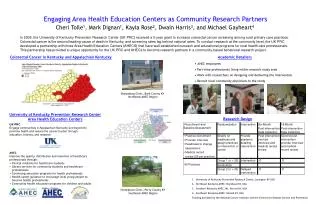
Mapping Hometowns of Exploration Participants • Used to reflect and discuss coverage areas and strategies • Observe year to year coverage and focus areas • Educate legislators on the scope of areas reached by the careers program (particularly rural)
Tracking Outcomes • Started with federal reporting tables required with 3 year competing renewal • 20+ students transitioning to health professions training programs (also 40+) • 20+ students entering pre-health training programs
More Formalized Process for Tracking • Continued year to year • Included in contracted plan of work with expectation of 70% response rate • Coordinators are asked to do the follow-up • Program office provides a list of students for their region who are identified as expected graduates w/20+ hours on record • In ’08, average time for follow-up was 35 minutes per unsuccessful contact attempt and 46 minutes per successful contact
Methods of Contact • Email (31.6%) • Phone (7%) • Snail Mail (1.9%) • Via Counselor or Teacher Contacts (23.3%) • Social Networking Sites – Facebook, Myspace (18.6%) • Other – mostly personal contacts outside of school (1.4%) • Unknown (16.3 %)
Outcome Categories • Students who have successfully transitioned to a health professions training program or are currently working in a health profession • Students who have transitioned to college, but have not yet committed to a health career • Students who have not yet graduated • Students who have dropped out or have graduated and did not continue to college or a health professions training program • Students who could not be found/no information available
4yr follow up of transition students • ’05 grads with 20+ hrs who were found to have transitioned to college with a commitment to a health career were followed up again in ‘09 • Done by intern (Health Promotion Undergrad) • 79 kids in pilot group • Averaged nearly 2 hrs per successful contact • Took 60hrs to complete • 64% of successful contacts made through Email, Myspace, or Facebook
OKAHEC Career Exploration Participants (20 or more hours of programming) Compare to 57% (state linear college-going rate) 100 Youth (95% Disadvantaged) (35% Minority) 90 Continue to College Or Other Training 56 Committed to Health Profession In the 1st year following high school graduation
OKAHEC Career Exploration Participants (20 or more hours of programming) 80% of those committed to HP in 1st year of college 94% retention rate (compared to 50% for state) 56 Committed to a Health Profession 53 Still in College Or Completed Training 45 Still Committed to Health Profession In the 4th year following High School Graduation
OKAHEC Career Exploration Participants (20+ Hrs) 45 Trained for a Health Profession or HP Graduate Program (Based on small numbers. Trends are preliminary)
Other Questions • What about those with <20 hrs? • What about graduate program transitions? (National Student Clearinghouse) • Job/Practice outcomes? (long term) • Is there a sweet spot for time spent with students? -Hours of activity related to outcomes (Logistic regression analysis)
Please Document Clearly, Collaborate, and Share Data Wherever Possible (Image: mental_floss©)