Download
1 / 6
60 likes | 207 Views
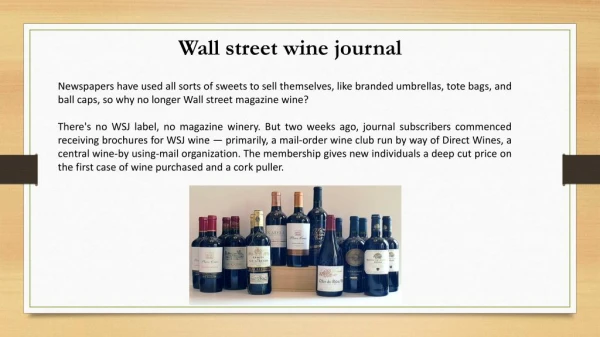
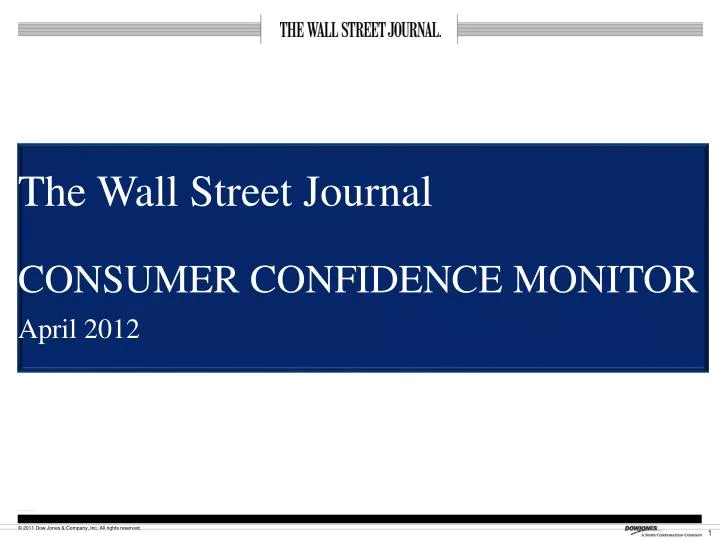
The Wall Street Journal CONSUMER CONFIDENCE MONITOR April 2012. Economic Outlook. Journal readers feel far more confident in the state of the U.S. economy than they did in Q4 2011.

E N D
The Wall Street JournalCONSUMER CONFIDENCE MONITORApril 2012
Economic Outlook Journal readers feel far more confident in the state of the U.S. economy than they did in Q4 2011 Base: Total Respondents: Wave 1: (1,380), Wave 24: (547), Wave 27: (563), Wave 28: (624), Wave 29: (504), Wave 30: (535), Wave 31: (517) Q: During the next 12 months, do you think that the nation’s economy will get better, get worse, or stay about the same?
Vehicle Purchases in the Next 12 Months Nearly two in five respondents (39%) are considering a vehicle acquisition next year with 11% of respondents actively planning to purchase a new vehicle. Journal subscribers are 57% more likely than the average to be in the market for a new vehicle. Base: Total Respondents: Wave 1: (1,380), Wave 24: (547), Wave 27: (563), Wave 28: (624), Wave 29: (504), Wave 30: (535), Wave 31: (517) Q: Are you or any other household members considering the purchase or lease of a new vehicle in the next 12 months?
Vehicle Purchases in the Next 12 Months Of respondents who plan to acquire a new vehicle in the next 12 months, 57% or nearly three-fifths plan to purchase new and the average amount they plan to spend is $37,200. In fact, plans to acquire a new vehicle increased from the previous survey, along with the average amount expect to spend. Base: Respondents considering purchase or lease of new vehicle within the year. Wave 3: (569), Wave 16: (150), Wave 18: (130), Wave 24: (199), Wave 27: (188), Wave 28: (208), Wave 29: (216), Wave 30: (190), Wave 31: (200) Q: For the vehicle planning to acquire next, how do you plan to acquire the new vehicle?/Q: Considering all additional features you would like to include, what would be the total value of the vehicle your are considering acquiring?
Methodology • Wave 17: July 13, 2010 – July 23, 2010 • Wave 18: August 16, 2010 – August 23, 2010 • Wave 19: September 21, 2010 – September 30, 2010 • Wave 20: October 25, 2010 – November 2, 2010 • Wave 21: December 6, 2010 – December 10, 2010 • Wave 22: January 31, 2011 – February 8, 2011 • Wave 23: February 28, 2011 – March 11, 2011 • Wave 24: April 4, 2011 – April 13, 2011 • Wave 25: May 5, 2011 – May 10, 2011 • Wave 26: June 3, 2011 – June 13, 2011 • Wave 27: August 1, 2011 – August 12, 2011 • Wave 28: October 3, 2011 – October 11, 2011 • Wave 29: December 5, 2011 – December 13, 2011 • Wave 30: February 6, 2012 – February 14, 2012 • Wave 31: April 2, 2012 – April 10, 2012 • SURVEY OBJECTIVE • Gauge level of optimism and perceptions of the economy among WSJ print subscribers and WSJDN users • Determine future purchase intentions • Review current investment strategies • FIELDWORK • 1,500 Wall Street Journal print and online panel members per wave are invited to participate • Conducted by Beta Research Corporation • Survey field dates • Wave 1: November 18, 2008 – December 7, 2008 • Wave 2: April 6, 2009 – April 14, 2009 • Wave 3: May 4, 2009 – May 11, 2009 • Wave 4: June 1, 2009 – June 8, 2009 • Wave 5: July 6, 2009 – July 13, 2009 • Wave 6: August 4, 2009 – August 10, 2009 • Wave 7: September 1, 2009 – September 11, 2009 • Wave 8 October 7, 2009 – October 14, 2009 • Wave 9: November 5, 2009 – November 16, 2009 • Wave 10: December 11, 2009 – December 16, 2009 • Wave 11: January 6, 2010 – January 13, 2010 • Wave 12: February 1, 2010 – February 8, 2010 • Wave 13: March 8, 2010 – March 16, 2010 • Wave 14: April 5, 2010 – April 14, 2010 • Wave 15: May 5, 2010 – May 18, 2010 • Wave 16: June 2, 2010 – June 15, 2010
The Wall Street JournalCONSUMER CONFIDENCE MONITORApril 2012