Download
1 / 46
480 likes | 792 Views
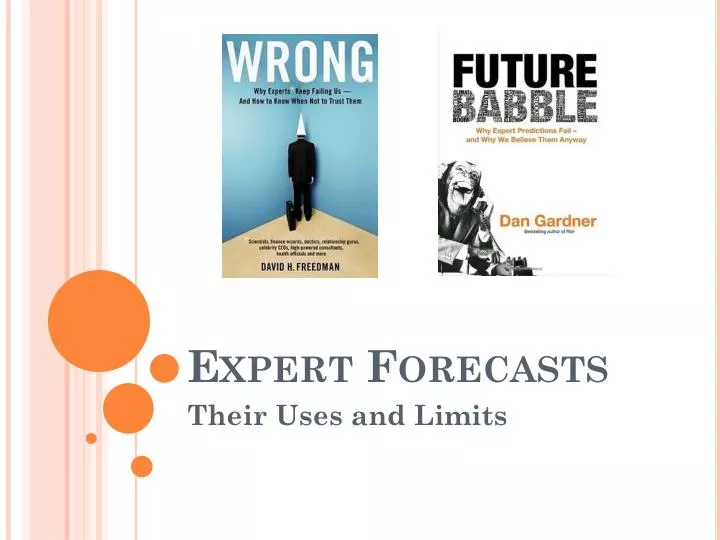
Expert Forecasts. Their Uses and Limits. I. Who Counts as an Expert Forecaster?. Expertise: Subject-specific (generally discipline and subfield, but some problems are interdisciplinary) Requires hundreds or thousands of hours of work/practice Accepted as expert by other experts (problems?)

E N D
Expert Forecasts Their Uses and Limits
I. Who Counts as an Expert Forecaster? • Expertise: • Subject-specific (generally discipline and subfield, but some problems are interdisciplinary) • Requires hundreds or thousands of hours of work/practice • Accepted as expert by other experts (problems?) • Forecasting: Claims have the form of a forecast (future outcome predicted from available data) • Reproducible Findings: • Claims are derived from evidence using valid (correct) and reliable (reproducible) methods • Claims are falsifiable • Claims are more accurate than chance or simple models
II. Obstacles to Expert Forecasting • The Elicitation Problem • Asking the right question – open-ended questions generally result in open-ended, vague, non-falsifiable, and eve out-of-expertise predictions • Stating predictions in the form of easily-observed variables • Ensuring that both/all branches of conditional forecasts are accounted for • Getting estimates of likely error or known biases, rather than just a point forecast
B. The Specificity Problem • Vague terms: Beginning/termination points of forecast are not specified, concepts which combine many variables are used in place of single variables, adjectives are nonspecific, etc. Example = horoscopes. • Direction without a scale. Saying something will “increase” necessitates have a measure of what level it is currently at. Example = “will undermine/enhance national security.”
C. The Contingency Problem • Single-issue vs. “package deal” predictions: Many forecasts are of the form of “If A and B and C and D – and not E, F, or G – then H.” Problem: forecast has so many conditions that its success or failure is unlikely to be observed since A-G are unlikely to line up in exactly the correct way. Forecasts of “A” are more testable.
D. The Bias Problem • Marcus (2008): Physicians give overly-optimistic estimates of patient survival time. Why?
D. The Bias Problem • Marcus (2008): Physicians give overly-optimistic estimates of patient survival time. Why? • Physicians have emotions (stress) and fear giving bad news but not good news • Evidence: Bias is more pronounced when physician has closer relationship to the patient
D. The Bias Problem 1. Asymmetric Loss Bias: Bias can be created by “asymmetric loss functions” – that is, when making an overly optimistic/pessimistic prediction that turns out to be incorrect carries greater costs that if the forecaster had erred in the opposite direction.
Asymmetric Loss Functions -- Examples From Alexander and Christakis (2008) • “For example, government experts making budget forecasts may be influenced by political incentives, as the costs of wrongly projecting a surplus may lead to public disapproval, while wrongly projecting a deficit may lead to an impression of exceptional government performance” (describing Elliot et al, 2005). • “In his study of the market for single family homes in a 1965 California town, Varian (1974) noticed that assessors faced a significantly higher cost if they happened to overestimate the value of a house. While in the case of an underestimate, the assessor's office faced the cost in the amount of the underestimate, conversely, in the case of the overestimate by an identical amount, the assessor's office faced a possibility of a lengthy and costly appeal process. Since this classic study, loss functions have become an important aspect of the study of expert forecasts.”
2. Affective Bias • People tend to overestimate the duration (and possibly the amount) of pain/pleasure or sadness/happiness they will feel if some event comes to pass. • Key cause is “focalism:” People focus on the event being predicted and forget all the other things they’ll be doing when/after it comes to pass.
Example (Press and Academic Takes) • “How we forecast our feelings, and whether those predictions match our future emotional states, had never been the stuff of laboratory research. But in scores of experiments, Gilbert, Wilson, Kahneman and Loewenstein have made a slew of observations and conclusions that undermine a number of fundamental assumptions...” —New York Times, 2003
Example (Press and Academic Takes) • Gilbert et al (1998): “People are generally unaware of the operation of the system of cognitive mechanisms that ameliorate their experience of negative affect (the psychological immune system), and thus they tend to overestimate the duration of their affective reactions to negative events. This tendency was demonstrated in 6 studies in which participants overestimated the duration of their affective reactions to the dissolution of a romantic relationship, the failure to achieve tenure, an electoral defeat, negative personality feedback, an account of a child’s death, and being rejected by a prospective employer.”
3.Political Bias: A Product of Both Asymmetric Loss and Affective Biases • The 51/49 Principle – Incentive to misrepresent certainty of forecast • Groupthink – Leader’s preferred focus becomes attractive to group members: those with “bad” forecasts are ostracized, fired, or executed • The “File Drawer Effect” – Even when private forecasts are unbiased, public ones may be biased by selective release • The Precautionary Principle – Exaggerate magnitude of consequences (often combined with 51/49 principle) • Source Bias – Media/public demand for “both sides” can allow “side” with poor forecasting record to continue to publicly forecast (e.g. most pundits)
A. Possible Political Consequences of Bias (As Opposed to Mere Error) • War: • Post-war disintegration of Iraq (Shinseki vs. Rumsfeld) • The fall of France, 1940 (“fighting the last war”) • Hitler’s invasion of Russia (“six-week campaign”) • World War I (“home by Christmas” and the idea that war was inevitable) • Famine: • “Great Leap Forward” killed up to 30 million • Economics: • Failure to “forecast” recession (already underway) huge increase in deficit in FY 2001 and FY 2002. Medicare drug projections politically limited to $400 billion (actual estimate was >$600 billion suppressed) • Environment: Forecast errors may lead to catastrophe (overly-optimistic forecasts) or economic turmoil / resignation (overly-pessimistic forecasts)
B. Does Our Own Bias Excuse Us From Accountability? 1. Problem: Because both experts and no-experts can influence policy (see the reading for limits on this influence), there is cognitive bias against admitting failure. “Cognitive blinders” include post-hoc justification and “selective amnesia” (I was right despite evidence to the contrary, I was only wrong because of some improbable and unforeseeable event, I wasn’t really involved in the policy, I was on the other side all along, I’ve “moved on” and so should you – all the way to actual mental illness) 2. Are these excuses? • What about, “I was wrong?” • What about, “I was wrong, but I relied on the experts?”
3. How Responsible Are We For Our Forecasts’ Effects: • On others’ behavior? • On our own behavior? • Do consequences matter, having good intentions, or something else? • Example: “A Clean Escape” (written 1985, TV adaptation 2007)
A. Accounting for Task Complexity • Difficulty: Task complexity appears to have more effect than forecaster differences. Some tasks are harder to predict than others • Example -- Stewart, Robert, and Bosart (1997) study on student, professor, and local media weather forecasts: All experts did better forecasting temperature than precipitation. Why?
A. Accounting for Task Complexity • Difficulty: Task complexity appears to have more effect than forecaster differences. Some tasks are harder to predict than others • Example -- Stewart, Robert, and Bosart (1997) study on student, professor, and local media weather forecasts: All experts did better forecasting temperature than precipitation. Why? • Temperature = fewer and linear predictors • Precipitation = many interacting and nonlinear predictors • Did the experts outperform the model?
A. Accounting for Task Complexity • Difficulty: Task complexity appears to have more effect than forecaster differences. Some tasks are harder to predict than others • Example -- Stewart, Robert, and Bosart (1997) study on student, professor, and local media weather forecasts: All experts did better forecasting temperature than precipitation. Why? • Temperature = fewer and linear predictors • Precipitation = many interacting and nonlinear predictors • Did the experts outperform the model? • All of them did – even the undergraduate!
B. Experts vs. Nonexperts • Does expertise matter for political forecasting? Tetlock (2005): • Evaluated 82,361 predictions from 284 people who were professionals tasked with “commenting or offering advice on political and economic trends.” (Real experts?) • Forecasters asked to make predictions both in and out of their areas of expertise, as were non-experts
Major Results • Overall accuracy: • Experts (in own area): Worse than flipping a coin (more precisely, choosing randomly between three possible outcomes) • Dilettantes (experts out of area): About the same • Well-informed non-experts: About the same • Uninformed non-experts: Somewhat worse • Some experts were more successful than others • More fame and money (pundits and consultants) is linked to more overconfidence and less predictive success (and vice versa) • “Foxes” who know a little about everything and take each prediction separately are more accurate than “hedgehogs” who focus on one area only and have a unified ideology or theory • Simple statistical models outperform the experts
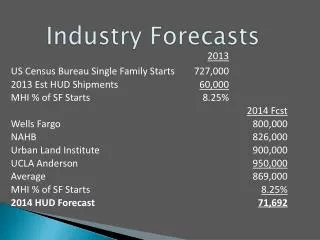
2. Experts vs. “The Wisdom of Crowds” A. Opinion Polls: Frequently wrong, but right when outcome is obvious. Example: Forecasting Election Winners (Oct)
B. Electoral Stock Markets • You can “buy” stock in a candidate (real money futures contracts) essentially a form of gambling • Theory: people who invest money have a huge stake in the outcome, so have incentives to weigh information carefully (invisible hand) • Findings: • Oddsmakers generally predict well
B. Electoral Stock Markets • You can “buy” stock in a candidate (real money futures contracts) essentially a form of gambling • Theory: people who invest money have a huge stake in the outcome, so have incentives to weigh information carefully (invisible hand) • Findings: • Oddsmakers generally predict well • Electoral stock markets outperform public pundits
1996: Widespread Agreement on Outcome: But Pundits Were Less Stable Indicators
Congress 2006: Blue (DH/DS) comes from behind Black (DH/RS) and Red (RH/RS)
B. Electoral Stock Markets • You can “buy” stock in a candidate (real money futures contracts) essentially a form of gambling • Theory: people who invest money have a huge stake in the outcome, so have incentives to weigh information carefully (invisible hand) • Findings: • Oddsmakers generally predict well • Electoral stock markets outperform public pundits • Even when informed, markets follow polls
B. Electoral Stock Markets • You can “buy” stock in a candidate (real money futures contracts) essentially a form of gambling • Theory: people who invest money have a huge stake in the outcome, so have incentives to weigh information carefully (invisible hand) • Findings: • Oddsmakers generally predict well • Electoral stock markets outperform public pundits • Even when informed, markets follow polls • Both polls and simple models outperform markets
D. Experts vs. Models • Models + expert opinions = little improvement over models alone (note that this is different from experts selecting from among several models) • Models always predict; experts may refuse • Models can be tested by “retrodiction,” while expert opinions can rarely be tested in this manner
Menand (2005) • “(M)ore than a hundred studies … have pitted experts against statistical or actuarial formulas, and in almost all of those studies the people either do no better than the formulas or do worse. In one study, college counselors were … asked to predict … freshman grades in college. The counselors had access to test scores, grades, the results of personality and vocational tests, and personal statements from the students, whom they were also permitted to interview. Predictions that were produced by a formula using just test scores and grades were more accurate. … In one (study), data from a test used to diagnose brain damage were given to a group of clinical psychologists and their secretaries. The psychologists’ diagnoses were no better than the secretaries’.”
IV. The Need for Models • Models outperform virtually every expert system • The useful experts are the ones who understand the models and can compare their performance over time • When experts consistently get it right, it appears they resort to models rather than intuition (Tetlock 2005) • Problem: What kind of model is appropriate? • Extrapolation (curve-fitting) • Regression (using measures of correlation) • Strategic (game theory) • Dynamic Systems (simulations or differential equations)


![JOB PROFLING EXPERT [JP EXPERT]](https://cdn3.slideserve.com/6713383/job-profling-expert-jp-expert-dt.jpg)