Download
1 / 33
330 likes | 472 Views
Comparison of LM Verification against Multi Level Aircraft Measurements (MLAs) with LM Verification against Temps. Ulrich Pflüger, Deutscher Wetterdienst. by means of Time Series (June 2001 until May 2003) of monthly average of

E N D
Comparison of LM Verification against Multi Level Aircraft Measurements (MLAs) with LM Verification against Temps Ulrich Pflüger, Deutscher Wetterdienst
by means of Time Series (June 2001 until May 2003) of monthly average of bias and rmse of 00h, 24h, 48h Forecasts based on all MLAs/Temps in LM area Variables are temperature wind velocity wind direction ComparisonofLM Verification against Multi Level Aircraft Measurements (MLAs)with LM Verification against Temps
Multi Level Aircraft Measurementsare • Several (not less than 4) single Aircraft Measurements during the climb or descent flight • which are piecewise combined • beginning with the lowest • next < 20 km horizontal distance of the first • vertical distance < 55 hPa • etc. • and then used like a Temp Measurement
LM Area All MLAs at 12 UTC 2003/05/01-2003/05/19
LM Area All Temps Stations 12 UTC 2003/05/01-2003/05/19
Bias of LM-Temperature against MLA Temps 00 UTC
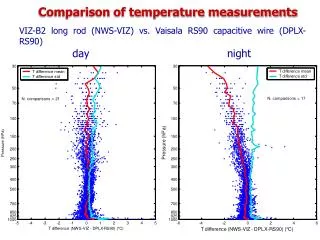
Analysis Analysis 24 h Forecast 24 h Forecast 48 h Forecast 48 h Forecast small bias, similar structures in both cases Forecasts have annual cycle, in upper and middle troposphere positive bias in Summer, negative in Winter, near ground predominantly negativ bias
RMSE of LM-Temperature against MLA Temps 00 UTC
similar structures in both cases 0.8 0.8 1.4 1.4 1.6 1.6 similar structures in both cases, rmse(Temps) overall about 0.2 K greater than rmse(MLA) 2.0 2.2 2.0 1.8
Bias of LM-Temperature against MLA Temps 12 UTC
below 800 hPA predominantly negativ, below 800 hPA Summer negativ, Winter positiv below 800 hPA predominantly negativ below 800 hPA Summer negativ, Winter positiv positiv bias < 0.4 K Negative bias > -0.3 K
RMSE of LM-Temperature against MLA Temps 12 UTC
Same as 00 UTC 1.4 1.4 1.6 1.6 2.0 2.2 1.8 1.6
Differences at Temperature Verification • Relative few differences between Verification based on MLAs and Temps • When bias is small there is predominantly a negative bias against MLAs and a positive bias against Temps • Overall rmse of 24/48 h Forecast is about 0.2 K greater in Verification based on Temps
Bias of LM-Wind Velocity against MLA Temps 00 UTC
Below 800 hPa, annual cycle, in winter strong positive bias Max.: 1.4 m/s Below 900 hPa predominantly negative bias Min.: -1.1 m/s, Winter less Below 800 hPa , annual cycle, in winter strong positive bias Max.: 1.8 m/s Below 900 hPa predominantly negative bias Min.: -0.8 m/s, Winter partly positive Max 0.2 m/s Below 900 hPa predominantly negative bias Min.: -0.8 m/s, Winter partly positiv Max 0.2 m/s Below 800 hPa , annual cycle, in winter strong positive bias Max.: 1.8 m/s
RMSE of LM-Wind Velocity against MLA Temps 00 UTC
Overall rmse(MLA) is about 0.5-1 m/s greater than rmse(Temps) Overall rmse(MLA) is equal to rmse(Temps) 3.5 3 3.5 3 Above 400 hPa rmse(Temps) is greater than rmse(MLA)
Bias of LM-Wind Velocity against MLA Temps 12 UTC
Below 800 hPa, annual cycle, in winter strong positive bias, Max.: 1.9 m/s Below 900 hPa predominantly negative bias Min.: -1.1 m/s, Winter partly positive, Max.: 0.2 m/s Below 800 hPa , annual cycle, in winter strong positive bias, Max.: 2.4 m/s Below 800 hPa Summer negative bias Min.: -0.6 m/s, Winter positive, Max 0.7 m/s Below 800 hPa Summer predominantly negative bias Min.: -0.6 m/s, Winter predominantly positive, Max 0.8 m/s Below 800 hPa , annual cycle, in winter strong positive bias, Max.: 2.3 m/s
RMSE of LM-Wind Velocity against MLA Temps 12 UTC
3 2 Same as 00 UTC 3 4 3 4
Differences at Wind Velocity Verification • bias with annual cycle • below 800 hPa • positive against MLA • negativ(Winter) to slight positive(Summer) 00 UTC • negativ(Winter) to positive(Summer) 12 UTC • rmse with annual cycle • at Analysis overall 0.5 -1 m/s higher against MLA (wind is nudged to Temps) • at Forecasts higher rmse against Temps above 400 hPa
Bias of LM-Wind Direction against MLA Temps 00 UTC
Below 800 hPa, strong positive bias Max.: 7.4 degree, smaller in spring and autumn Below 900 hPa negative bias Min.: -4.9 degree, Winter less Below 800 hPa, strong positive bias Max.: 10.3 degree Below 900 hPa predominantly negative bias Min.: -7 degrees, Winter partly positive Max.: 6 degrees Below 900 hPa predominantly negative bias Min.: -10 degrees, Winter partly positiv Max 6 degrees Below 800 hPa, strong positive bias Max.: 13.5 degree
RMSE of LM-Wind Direction against MLA Temps 00 UTC
Overall rmse(MLA) is about 5-10 degrees greater than rmse(Temps) 10 20 Overall rmse(MLA) is equal to rmse(Temps), except Summer 30 30 Above 400 hPa rmse(Temps) is partly greater than rmse(MLA) 40 40
Bias of LM-Wind Direction against MLA Temps 12 UTC
Below 800 hPa, strong positive bias Max.: 6.1 degree, smaller as 00 UTC Below 900 hPa Winter negative bias Min.: -4.1 degree, Summer positive Below 800 hPa, strong positive bias Max.: 10.1 degree Below 900 hPa predominantly positive Max.: 8 degrees, Winter smaller or negative Below 900 hPa predominantly positive, Max.: 9 degrees, single months in winter positive Below 800 hPa, strong positive bias Max.: 10.6 degree, smaller than 00 UTC
RMSE of LM-Wind Direction against MLA Temps 12 UTC
Overall rmse(MLA) is about 5-10 degrees greater than rmse(Temps) Below 400 hPa rmse(MLA) is equal to rmse(Temps) except Summer Above 400 hPa rmse(Temps) is partly greater than rmse(MLA)
Differences at Wind Direction Verification • bias with annual cycle • below 800 hPa • Analysis and Forecast against MLAS strong positive • Analysis against Temps slight negative below 900 hPa, slight positve above against Temps • Forecasts against Temps partly slight negativ(Winter) to slight positive(Summer) 12 UTC • rmse with annual cycle • at Analysis overall 5 -10 degrees higher against MLA (wind is nudged to Temps) • at Forecasts higher rmse against Temps above 400 hPa • at Forecasts higher rmse against MLA in Summer
Summary • Temperature Verification shows only few differences between the two measuring systems • Wind Verification shows below 800 hPa great differences between the two measuring systems • Regarding the Wind Verification results up to now (Synop, Temp) LM is more likely to underestimate wind velocity • Regarding the verification against aircraft measurements it seems that aircraft measurements below 800 hPa underestimate wind velocity (up to 2 m/s in the boundary layer).