Download
1 / 16
160 likes | 363 Views
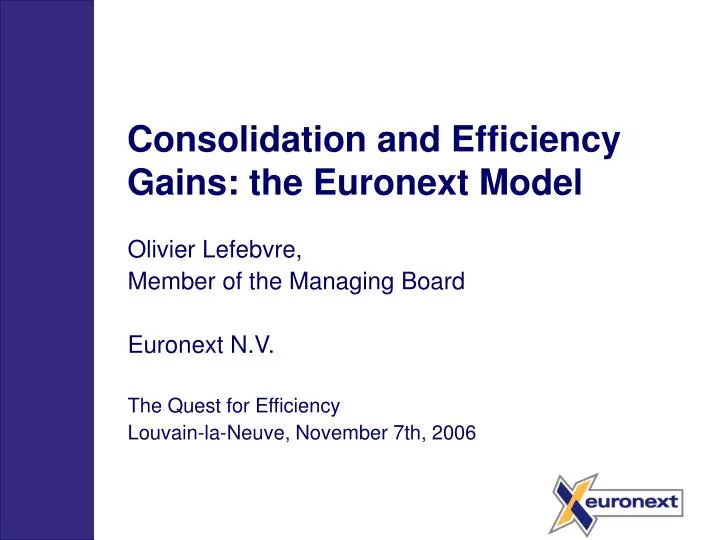
Consolidation and Efficiency Gains: the Euronext Model. Olivier Lefebvre, Member of the Managing Board Euronext N.V. The Quest for Efficiency Louvain-la-Neuve, November 7th, 2006. Euronext at a glance. Euronext Model. Multi-juridiction model : several home regulators.

E N D
Consolidation and Efficiency Gains: the Euronext Model Olivier Lefebvre, Member of the Managing Board Euronext N.V. The Quest for Efficiency Louvain-la-Neuve, November 7th, 2006
Euronext at a glance EuronextModel Multi-juridiction model : several home regulators Created in 2000, Euronext is the cross-border exchange : in four years, Euronext brought together Amsterdam, Brussels, Lisbon, Paris and Liffe exchanges Horizontal model : divested from post-trade activities Euronext’s open architecture is focused on its core activity: trading and listingfinancial instruments and disengaged from clearing and settlement activities Technological integration of trading platforms is the the basis of its consolidation process • Synergies : • single trading platform • single rule book • single list Goal: Meeting Users’ needs (market efficiency, low costs and reduced fees)
Investors Investors Cross border trades Cross border trades Brokers Brokers Remote membership Exchange B Exchange C Issuers Issuers Integration Model Investors Brokers Exchange A Issuers
Investors Cross border trades Cross border trades Brokers Remote membership Exchange B Issuers Loss of home value Adjustment cost Liquidity is sticky Integration Model Old View : Single market by concentration Investors Investors Brokers Brokers Exchange A Exchange C Issuers Issuers
Investors Investors Cross border trades Cross border trades Brokers Brokers Single System Single Rule Book Remote membership Exchange B Exchange C Issuers Issuers Integration Model: Euronext View Single market by integration Investors Brokers Exchange A Issuers
3. Reduce implicit trading costs by increased liquidity 2. Direct access to full range = cost savings Investors Investors Cross border trades Cross border trades Brokers Brokers Single System Single Rule Book Remote membership Exchange B Exchange C Issuers Issuers 4. More international exposure 5. No disruption of “home” markets Integration Model – Five Economic Benefits Investors Brokers 1. Cost synergies Exchange A Issuers
The Euronext regulatory model A Multi-jurisdiction model Members choose one “preferred” entry point P X Z F B NL Euronext « RuleBook 1 » Listed companies choose their jurisdiction of Listing
The Euronext regulatory model • A Multi-jurisdiction model • Cooperation between 5 National Regulators • Organised Through a MOU: • AFM, AMF, CBFA, CNVM, FSA • Chairs Committee, Steering Committee, • 5 working parties
Open Straight Through Processing • Trading • Central order books and harmonized market rules • Local regulators . Local access points • Clearing • Central Counterparty . Optimized Risk Management Group Settlement Group
Direct user benefits resulting from the integration of Euronext markets • Reduced internal operating costs (Explicit trading costs) • Savings on IT assets and human capital resources needed to access and monitor separate trading platforms • Optimized trading organization • Exchange fees decrease (Explicit trading costs) • Passing cost synergies to users • Wider trading opportunities • Larger set of directly tradable securities • Direct access to all Euronext markets • Increased cross-border trading • Increased liquidity (Implicit trading costs) • Lower bid-ask spread, greater volume, lower volatility
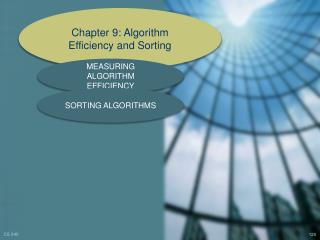
Anincontestable integration track record… From 10 trading systems… …to 2, respecting domestic regulations 2001 2004 Liffe.Connect DERIVATIVES TRADING Amsterdam, Brussels, London, Lisbon, Paris Independent Settlement & Custody Euroclear/Crest Independent Clearing LCH.Clearnet NSC CASH TRADING Amsterdam, Brussels, Lisbon, Paris S.T.P
…delivering strong IT costs benefits… > One single trading platform for all cash markets > Close down of Brussels > One single trading platform Datacenter For all derivatives markets > Close down of Amsterdam and Lisbon Datacenters 268 > Benefits from AEMS > AEMS integration integration > Increase in Trading 253 € -15m Platforms capacity € -50m 63 203 200 77 190 € -10m 40 40 40 206 176 164 160 150 2003 2004 2005 2006e 2007e Running costs Development costs Note: Running costs include Depreciations
nb of trades (million) AVG fee per trade € 1.53 162.4 1.38 149.4 141.4 1.25 137.9 1.11 122.8 1.08 2001 2002 2003 2004 2005 Direct user benefits resulting from the integration of Euronext markets Trading fees (explicit trading costs) - Average trading fees fell by 30% in the period from 2001 to 2005
Improved Direct Access and International Exposure - Example: More foreign members on Euronext Brussels
Improved liquidity - Example: Euronext Brussels