Download
1 / 17
170 likes | 175 Views
Comparative Hazard Assessment CR Carpi Meeting October 2016. Professor C. Vyvyan Howard v.howard@ulster.ac.uk. Risk Assessment – 4 phases. Hazard identification – requires insight and understanding of the system in question

E N D
Comparative Hazard AssessmentCR Carpi Meeting October 2016 Professor C. Vyvyan Howard v.howard@ulster.ac.uk
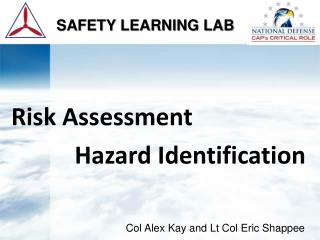
Risk Assessment – 4 phases • Hazard identification – requires insight and understanding of the system in question • Hazard assessment – costs time and money for hard science – positive findings require action • Exposure assessment – can be very expensive and, for human exposure, complex • Risk assessment – depends totally on the 1st three steps
So the argument goes…. • It doesn’t matter how hazardous a substance is – if no exposure occurs, there is no risk • However experience reminds us that such assurances are frequently hollow • The fall back is that if it is only hazardous to a certain extent – then it is safe to be exposed to “this much” for the whole of your life
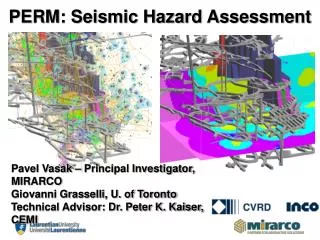
Complex Systems • Risk assessment is now being applied to very complex systems - such as ecosystems • It is impossible to have comprehensive hazard data for such systems • Missing data is often provided by ‘data models’, but these can be subjective • Sometimes the whole risk assessment can be based solely upon data models
Comparative Hazard Assessment (CHA) • Pragmatic approach of use to decision-makers in prioritising actions • Chemicals are assessed according to known hazards • They are then ranked in order of hazard • No exposure assessment is made • The least hazardous substances are substituted for more hazardous ones
An example with pesticides • Pesticides are usually well characterised • Hazard Trigger Algorithm (HTA) constructed • Trigger values set empirically (at several levels if required) • Policy for missing data (precautionary?) • Substances assigned to RED, AMBER or GREEN categories
Hazard trigger flow chart (Tables referred to are presented below)
Outcome of the CHA • As a result of the application of the CHA algorithm to 858 active ingredients (in 6,600 products), 132 pesticide active ingredients were placed on a prohibited RED list and 325 were placed on a restricted AMBER use list. The remaining 401 active ingredients were placed on an unrestricted GREEN list
Disadvantages • Many sets of substances are poorly characterised w.r.t hazards (eg nanomaterials, cosmetic ingredients etc) • Then it is difficult to construct an HTA • One can apply a precautionary value to missing data (eg RED list). This then pushes manufacturers to produce the data
Advantages • Relatively uncostly and quick to produce, if the data is to hand • Avoids having to rely on exposure assessments. • Provides a powerful pragmatic tool for decision-makers to make decisions! (which is why producers generally hate it) • Predictive – many of the chemicals on the RED list subsequently banned by regulator
Acknowledgments • I would like to thank those who worked on this project with me: • Charley Clutterbuck • David Buffin • Christopher Stopes