Download
1 / 24
240 likes | 244 Views
U.S. Resilience Initiatives. Dan T. Ton Energy Resiliency Task Force Meeting December 17, 2015. Climate Change and Extreme Weather Resilience. Every $1 on protection measurements can prevent $ 4 in repairs after a storm.

E N D
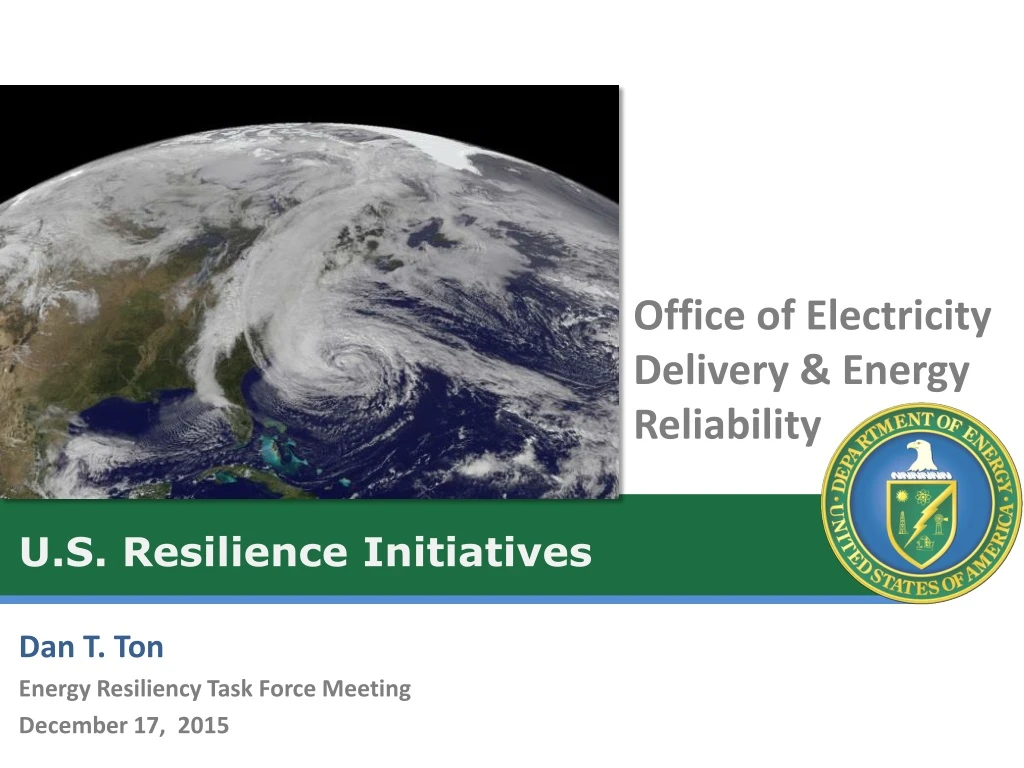
U.S. Resilience Initiatives Dan T. Ton Energy Resiliency Task Force Meeting December 17, 2015
Climate Change and Extreme Weather Resilience Every $1 on protection measurements can prevent $4 in repairs after a storm. Trends indicate the situation will get worse, not better. 2
OE Analysis of Climate Impacts and Electrical Infrastructure Resiliency Studying Sea-Level Rise (SLR) Effects on Energy Infrastructure • Developed a proof of concept approach through 2100. • Tested concept on four metropolitan statistical areas (MSAs) – New York City, Miami, Houston, and Los Angeles, and published report. • Expanding work to assessfour communities(Boston, Philadelphia, Hampton Roads ,VA, Mobile, AL). OE-EPSA Future Study on Cost and Benefit Estimates of U.S. Coastal Energy Exposure, Impacts, and Resilience Measures • Developing a methodology to assess costs and benefits of climate impacts and resiliency for electricity infrastructure
Resilient Distribution Grid Design Tool Enable distribution grid designers to prioritize cost-effective system upgrades and expansions to minimize future damage to their grid and outages to customers • Leverage modules developed under DHS National Infrastructure Simulation and Analysis Center (NISAC): • Developed a prototype resilience design tool for multiple hazards (ice and flooding) in FY15 • Begin developing “recovery” modules in FY16 4
Energy Surety Design Methodology • NJ TransitGrid Project • Microgrid to enhance grid-rail resiliency to serve over 900,000 riders/day • Key evacuation service for Manhattan & N. New Jersey • MOU between DOE and State of NJ • Completed the feasibility study of a microgrid to fortify the public transportation network Hoboken Project • Provide electrical power to support critical functions up to 7 days for 52,000 residents in 1.2 sq. mi. • Key evacuation route for Manhattan • DOE-Hoboken-BPU-Sandia-PSEG Partnership • Completed a microgrid conceptual design for Hoboken, NJ, to enhance system resilience post-Sandy 5
July 5, 2012 Storm Response in Chattanooga • Automated feeder switching technology: • Equipment cost $51 million • In this storm, avoided $23 million in damages to customers, eliminated 500 truck rolls, andreduced restoration costs to the utility by $1.4 million by restoring 1.5 days early Avoided customer outage minutes are translated into avoided customer costs by the Interruption Cost Estimation (ICE) Calculator (www.icecalculator.com) Number of customers experiencing sustained outages Time (hours) 6
Framework for Developing Resilience Metrics Resilience Metric:Used to compare performanceof improved system vs. baseline Define System & Resilience Metrics Define System & Resilience Metrics Define Resilience Goals Define Resilience Goals Characterize Threats Characterize Threats Evaluate Resilience Improvements Evaluate Resilience Improvements Determine Level of Disruption Determine Level of Disruption Calculate Consequence Calculate Consequence Define & Apply System Models Define & Apply System Models 7 Resilience Analysis Process: How metrics should be defined and used
Framework for Developing Resilience Metrics An exemplar consequence distribution is created to account for uncertainty (Threat intensity, Available resources, System response, Interdependencies, Disruption impacts, etc.) Performance Indicators Alternative units: Safety, Economics, Population affected, etc… This distribution is the RESILIENCE METRIC. 8
Energy Storage Methodology and Evaluation Tool: BPA / DOE / Puget Sound Grid Project PNNL Analysis Program selects cost-effective site and scale to optimize Value Stream Primus Power, to install 500kW / 2MWh ZnBr Flow Battery, developed with ARRA funding 9
Quadrennial Energy Review (QER): Background and Process Scope of QER 1.1 • Presidential Memorandum stated the Administration will conduct a QER to be led by the White House Domestic Policy Council and Office of Science and Technology Policy • Supported by a Secretariat established at the Department of Energy • Process involves the robust engagement of federal agencies and outside stakeholders • Enables the federal government to translate policy goals into a set of analytically based, integrated actions for proposed investments over a four-year planning horizon Fuels Waste Scope of QER 1.2 10
Decreased N. American energy imports Climate change impacts Vulnerabilities more evident, including aging infrastructures, physical and cyber threats Increased interdependencies Increased energy support required by allies Context for QER: Changing US Energy Landscape INCREASING ENERGY PRODUCTION Natural gas production growth Oil production growth Intermittent renewables Distributed generation/energy resources Increased generation/production/demand efficiency TECHNOLOGY ADVANCES Solar (central and rooftop) Wind Demand-side Hydraulic fracturing POLICY DEVELOPMENTS CAFÉ Clean Air Act -111 (d), other Clean Water Act/other RFS RPS (state) RGGI (regional) ENERGY SECURITY CHANGES 11
QER Process STAKEHOLDER ENGAGEMENT • Stakeholder meetings • Stakeholder comments • Technical workshops • Regular briefings ANALYSIS • Baselines • Scenarios and modeling • Analysis of disruptive events • Synthesis of available work INTERAGENCY COLLABORATION • Technical expertise • Data, studies, analysis • Interim and final product reviews 12
Output of QER Process • Integrated view of the short‐, intermediate‐, and long‐term objectives for Federal energy policy (economic, environmental, and security priorities); • Outline of legislative proposals to Congress; • Executive actions (programmatic, regulatory, fiscal, etc.) coordinated across multiple agencies; • Resource requirements for RD&D and incentive programs; and • Strong analytical base for decision-making, insights on industry trends and economic impacts 13
Complementary to QER: Partnership for Energy Sector Climate Resilience Partnership announced on April 21, 2015 by Vice President Biden and Energy Secretary Moniz - Approximately 20 companies have joined representing a geographically dispersed array of investor-owned, federal, state, municipal and cooperatives,serving approximately 25% of U.S. customers. *For more info: http://www.energy.gov/epsa/partnership-energy-sector-climate-resilience Provides a mechanism for sustained engagement between DOE and electricity companies to: • Exchange information: user-friendly climate data, decision tools and best practices • Develop methodologies and assess cost and benefits of climate resilience solutions • Identify opportunities for deployment of climate-resilient energy technologies, practices and policies Partners commit to: • Identify priority vulnerabilitiesto electricity infrastructure • Identify and pursue priority climate resilience strategies • Report on climate resilience activities implemented, milestones accomplished, and progress in enhanced energy climate resilience Creates a forum where companies pursuing action on climate resilience can receive recognition for their achievements 14
Climate Change Vulnerability Report Report: “Climate Change and the U.S. Energy Sector: Regional Vulnerabilities and Resilience Solutions” • Higher temperatures, droughts, extreme heat waves, wildfires, sea level rise and intense storms are causing power and fuel disruptions for millions of people in all regions • Resilience opportunities include: • development and deployment of innovative climate-resilient energy technologies • improved data and models to better inform stakeholders of vulnerabilities and response opportunities • “hardening” of existing facilities and structures to better withstand impacts of future climate change and extreme weather. http://www.energy.gov/epsa/initiatives/us-energy-sector-vulnerability-report 15
Water-Energy Nexus: Why Now? • Energy and water are interdependent. • Water scarcity, variability, and uncertainty are becoming more prominent. • This is leading to vulnerabilities of the U.S. energy system. • We cannot assume the future is like the past in terms of climate, technology, and the evolving decision landscape. • Aging infrastructure brings an opportunity to make some changes. • DOE has strong expertise in technology, modeling, analysis, and data and can contribute to understanding the issues and pursuing solutions across the entire nexus. Download the full report at energy.gov 16
Implications of Climate Change • The future of the water-energy nexus will bring changes and variation in the availability of water resources due to: • increasing temperatures • changes in precipitation patterns • increasing climate variability • more frequent extreme weather events (e.g., floods and droughts) Temperature Change in the U.S. (1901-2012) Source: EPA (2013) 17
Variability in Water Resources Annual Average Precipitation (2010 -2012) 2010 2011 2012 • Variability in available water resources will pose challenges for: • Optimizing operations (especially for hydroelectric plants) • Developing effective water management strategies • Choosing sites for energy production activities Source: PRISM Climate Group, OSU 18
Water-Energy Decision-Making Landscape is Complex The water-energy decision-making landscape is characterized by market and non-market drivers varying by region and sector. 19
Strategic Pillars • Optimize the freshwater efficiency of energy production, electricity generation, and end use systems • Optimize the energy efficiency of water management, treatment, distribution, and end use systems • Enhance the reliability and resilience of energy and water systems • Increase safe and productive use of nontraditional water sources • Promote responsible energy operations with respect to water quality, ecosystem, and seismic impacts • Exploit productive synergies among water and energy systems 20
Resilience Going Forward Invitation to pair up/ contact your nearest Climate Action Champion to share experiences, capabilities, etc.. White House Fact Sheet: http://www.whitehouse.gov/the-press-office/2014/12/03/fact-sheet-16-us-communities-recognized-climate-action-champions-leaders Resilient Electricity Delivery Infrastructure (REDI) Funding Opportunity Announcement to improve climate preparedness and resiliency of electricity delivery infrastructure for local/tribal governments (open until May 4, 2015). For more information see: http://www.netl.doe.gov/business/solicitations/details?title=9ffc4b38-2b18-4ce6-94a6-2da82c09126d
Electric Resilience Assessment Program-Distribution (ERAP-D) Tool for Distribution Utilities to Assess Resilience • Self-assessment tool in development in close cooperation with industry • Builds on concepts generated for DHS to capture and display Critical Infrastructure protection and resilience information Notional dashboard for an electric utility • Utilizes methodology developed for the Infrastructure Survey Tool (IST) in support of the DHS Enhanced Critical Infrastructure Protection Program (ECIP) • Developing the proof-of-concept tool in FY15 • Transitioning the tool for use by distribution utilities in FY16 23