Download
1 / 13
130 likes | 246 Views
A Software Skeleton for the Full Front-End Crate Test at BNL. Goal: to p rovide a working data acquisition (DAQ) system for the coming full FE crate test In this talk, I will describe the overall system setup cover various software components and

E N D
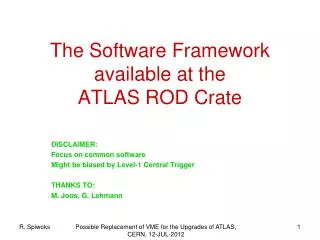
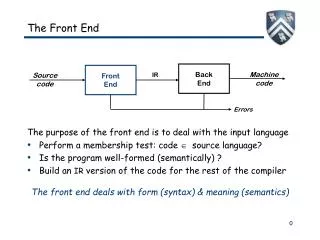
A Software Skeleton for the Full Front-End Crate Test at BNL • Goal: to provide a working data acquisition (DAQ) system for the coming full FE crate test • In this talk, I will • describe the overall system setup • cover various software components and • report their status and/or what we intend to do Kin Yip
Host 1 PTG TTC Control DAQ-1 trigger FE Crate Trigger Tower Board Calib. board trigger veto PU FEB ReadOut Card ~VME memory Host 2 Signal from a pulser (triggered by TTC) Data (through optical link) • “Host 2” — single board in the same crate as the Read Out Card — is a diskless node booted from “Host 1” through the network
Control Crate (Wiener VME with CERN extension) To control : Workstation Control Crate configure various boards in the FEC • By using a PCI/VME bridge “Bit3”, the PCI bus on the workstation “maia” and the remote VMEbus in the Control Crate share memory and I/O • Programmed IO (PIO) • Dynamic Memory Access (DMA) • We have upgraded the operating system and the software driver for Bit3 (now from SBS). We have tested : • PIO : 3 MBytes per second • DMA : 15-16 Mbytes per second the obvious way to go • PTG (Pulse Trigger Generator, BNL-made) has been used to generate triggers in this new set of OS and Bit3 driver. • Other electronic components including TTC (with TTCvx and TTCvi) and the SPAC will have to be integrated into this system.
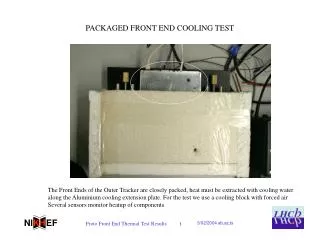
Read-Out Crate [Wiener VME (9U/6U) ] • Different from before, the CPU (VMIC) board is in the same crate as the electronic boards (2 Read-Out Cards) • Similarly, there is also a PCI/VME bridge “Tundra-Universe” that we have used to allow the CPU board to communicate with the electronic boards through the VME backplane • We have also upgraded the operating system and the software driver for this PCI/VME bridge. We have also tested : • DMA : 15-16 Mbytes per second • PIO : almost the same as above • We will have to develop the software to configure and read from the two Read-Out Cards when they are available, presumably with the help from the board maker in a similar way that we have done with the ROD Demo Board
Data volume and storage A very rough estimate : • No. of channels ~ 16 128 = 2048 • 128 channels 2 K bytes • 16 FEB 32K bytes per event • In a very rough estimation, if we take about 100 K events a day for 5 months, we will end up with ~500 GB of data. • We’ll use Magda (a distributed data manager prototype for Grid-resident data developed at BNL) to manage data transfer and storage • http://atlassw1.phy.bnl.gov/magda/info • We have tested and transferred data from our workstation through the USATLAS cluster to the HPSS (High Performance Storage System) at BNL. • The automatic procedures require two endless loops, one in our workstation (the one connected to the Control Crate) and one in the USATLAS cluster that has the appropriate read/write privilege from/to the HPSS • If desirable, we can replicate the data from BNL to CERN (Castor) which is said to have a cost of 2 SF per Gbyte.
Event Monitoring in DAQ-1 • Basically, the “Event Sampler” process/interface in DAQ-1 gets the data and pass the data to the “Monitoring Task” process/interface • The “Monitoring Task” would unpack the data and analyze to produce, say, (Root) histogram and then • use the “Histogram Provider” to publish the histograms • The “User Histogram Task” would “receive” the histogram so that any user can examine
Data format, channel mapping and analysis • Data format will be essentially whatever the Read-Out Card maker provides • Each run will start with a new file and the run no. is part of the filename • We expect to have some configuration information in the header/trailer • For Channel mapping, we want to put the mapping in the database and I have started with the one in Athena • We have to take care of all the hardware components such as FeedThrough, preamplier, motherboard etc. • Anaysis code in the framework of a simple C program will materialize at the debugging stage, as we need to check whether the data read out is correct, just like what happened to the ROD Demo exercise • For the general users, we provide the I/O unpacking routine and 3 stage skeleton interface, namely, “initialization, execution and finalization” so that the users can develop their analysis code easily in this framework
Runbook, Bookkeeping and DCS • Through the Web and Database server, we will provide the “Runbook” from which users may search for the system configuration for each run. • We will set up a simple report logging system for the “run shifters” to write down their concern or any special features or problems at certain run or time. • We will probably use the OBK (Online BookKeeing) feature in the DAQ-1 as it has easy access to all the run information. • The OBK experts have promised to provide an updated version which provides a Web-based interface. • In any case, the information will be available through the Web server • The DCS (Detector Control System) measurements taken from the FEC will be done asynchronously with respect to the rest of data acquisition • We have sent a PC to CERN and the DCS software system is being set up • We have to figure out what parameters we need to measure • The DCS information will be transferred to the Database and Web servers so that it is readily available to all users