Download
1 / 39
390 likes | 393 Views
Learn about the theory of network flows and its application in determining the edge and vertex connectivity of a graph in the context of metabolic networks. Explore constructive proofs of Menger's theorem and algorithms for finding disjoint directed paths.

E N D
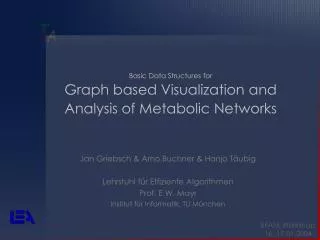
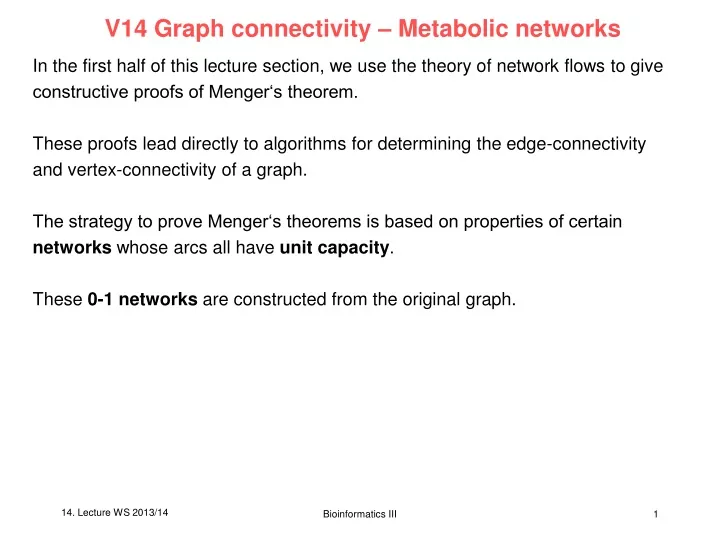
V14 Graph connectivity – Metabolic networks In the first half of this lecture section, we use the theory of network flows to give constructive proofs of Menger‘s theorem. These proofs lead directly to algorithms for determining the edge-connectivity and vertex-connectivity of a graph. The strategy to prove Menger‘s theorems is based on properties of certain networks whose arcs all have unit capacity. These 0-1 networks are constructed from the original graph. Bioinformatics III
Determining the connectivity of a graph Lemma 12.3.1. Let N be an s-t network such that outdegree(s) > indegree(s), indegree(t) > outdegree (t), and outdegree(v) = indegree(v) for all other vertices v. Then, there exists a directed s-t path in network N. Proof. Let W be a longest directed trail (trail = walk without repeated edges; path = trail without repeated vertices) in network N that starts at source s, and let z be its terminal vertex. If vertex z were not the sink t, then there would be an arc not in trail W that is directed from z (since indegree(z) = outdegree(z) ). But this would contradict the maximality of trail W. Thus, W is a directed trail from source s to sink t. If W has a repeated vertex, then a part of W determines a directed cycle, which can be deleted from W to obtain a shorter directed s-t trail. This deletion step can be repeated until no repeated vertices remain, at which point, the resulting directed trail is an s-t path. □ Bioinformatics III
Determining the connectivity of a graph Proposition 12.3.2. Let N be an s-t network such that outdegree(s) – indegree(s) = m = indegree(t) – outdegree (t), and outdegree(v) = indegree(v) for all vertices v s,t. Then, there exist m disjoint directed s-t path in network N. Proof. If m = 1, then there exists an open eulerian directed trail T from source s to sink t by Theorem 6.1.3. Review: An eulerian trail in a graph is a trail that visits every edge of that graph exactly once. Theorem 6.1.3. A connected digraph D has an open eulerian trail from vertex x to vertex y if and only if indegree(x) + 1 = outdegree(x), indegree(y) = outdegree(y) + 1, and all vertices except x and y have equal indegree and outdegree. Euler proved that a necessary condition for the existence of Eulerian circuits is that all vertices in the graph have an even degree. Theorem 1.5.2. Every open x-y walk W is either an x-y path or can be reduced to an x-y path. Therefore, trail T is either an s-t directed path or can be reduced to an s-t path. Bioinformatics III
Determining the connectivity of a graph By way of induction, assume that the assertion is true for m = k, for some k 1, and consider a network N for which the condition holds for m = k +1. There does exist at least one directed s-t path P by Lemma 12.3.1. If the arcs of path P are deleted from network N, then the resulting network N - P satisfies the condition of the proposition for m = k. By the induction hypothesis, there exist k arc-disjoint directed s-t paths in network N - P. These k paths together with path P form a collection of k + 1 arc-disjoint directed s-t paths in network N. □ Bioinformatics III
Basic properties of 0-1 networks Definition A 0-1 network is a capacitated network whose arc capacities are either 0 or 1. Proposition 12.3.3. Let N be an s-t network such that cap(e) = 1 for every arc e. Then the value of a maximum flow in network N equals the maximum number of arc-disjoint directed s-t paths in N. Proof: Let f* be a maximum flow in network N, and let r be the maximum number of arc-disjoint directed s-t paths in N. Consider the network N* obtained by deleting from N all arcs e for which f*(e) = 0. Then f*(e) = 1 for all arcs e in network N*. It follows from the definition that for every vertex v in network N*, and Bioinformatics III
Basic properties of 0-1 networks Thus by the definition of val(f*) and by the conservation-of-flow property, outdegree(s) – indegree (s) = val(f*) = indegree(t) – outdegree(t) and outdegree(v) = indegree(v), for all vertices v s,t. By Proposition 12.3.2., there are val(f*) arc-disjoint s-t paths in network N*, and hence, also in N, which implies that val(f*) r. To obtain the reverse inequality, let {P1,P2, ..., Pr} be the largest collection of arc-disjoint directed s-t paths in N, and consider the function f: EN R+defined by Then f is a feasible flow in network N, with val(f) = r. It follows that val(f*) r. □ Bioinformatics III
Separating Sets and Cuts Review from §5.3 Let s and t be distinct vertices in a graph G. An s-t separating edge set in G is a set of edges whose removal destroys all s-t paths in G. Thus, an s-t separating edge set in G is an edge subset of EG that contains at least one edge of every s-t path in G. Definition: Let s and t be distinct vertices in a digraph D. An s-t separating arc set in D is a set of arcs whose removal destroys all directed s-t paths in D. Thus, an s-t separating arc set in D is an arc subset of ED that contains at least one arc of every directed s-t path in digraph D. Remark: For the degenerate case in which the original graph or digraph has no s-t paths, the empty set is regarded as an s-t separating set. Bioinformatics III
Separating Sets and Cuts Proposition 12.3.4 Let N be an s-t network such that cap(e) = 1 for every arc e. Then the capacity of a minimum s-t cut in network N equals the minimum number of arcs in an s-t separating arc set in N. Proof: Let K* = Vs ,Vt be a minimum s-t cut in network N, and let q be the minimum number of arcs in an s-t separating arc set in N. Since K* is an s-t cut, it is also an s-t separating arc set. Thus cap(K*) q. To obtain the reverse inequality, let S be an s-t separating arc set in network N containing q arcs, and let R be the set of all vertices in N that are reachable from source s by a directed path that contains no arc from set S. Then, by the definitions of arc set S and vertex set R, t R, which means that R, VN - R is an s-t cut. Moreover, R, VN - R S. Therefore Bioinformatics III
Separating Sets and Cuts which completes the proof. □ Bioinformatics III
Arc and Edge Versions of Menger’s Theorem Revisited Theorem 12.3.5 [Arc form of Menger‘s theorem] Let s and t be distinct vertices in a digraph D. Then the maximum number of arc-disjoint directed s-t paths in D is equal to the minimum number of arcs in an s-t separating set of D. Proof: Let N be the s-t network obtained by assigning a unit capacity to each arc of digraph D. Then the result follows from Propositions 12.3.3. and 12.3.4., together with the max-flow min-cut theorem. □ Theorem 12.2.4 [Max-Flow Min-Cut] For a given network, the value of a maximum flow is equal to the capacity of a minimum cut. Proposition 12.3.3. Let N be an s-t network such that cap(e) = 1 for every arc e. Then the value of a maximum flow in network N equals the maximum number of arc-disjoint directed s-t paths in N. Proposition 12.3.4 Let N be an s-t network such that cap(e) = 1 for every arc e. Then the capacity of a minimum s-t cut in network N equals the minimum number of arcs in an s-t separating arc set in N. Bioinformatics III
Metabolic Networks - Introduction There exist different levels of computational methods for describing metabolic networks: - stoichiometry/kinetics of classical biochemical pathways (glycolysis, TCA cycle, ... - stoichiometric modelling (flux balance analysis): theoretical capabilities of an integrated cellular process, feasible metabolic flux distributions - automatic decomposition of metabolic networks (elementary nodes, extreme pathways ...) • kinetic modelling of coupled cellular pathways (E-Cell ...) General problem: lack of kinetic information on the dynamics and regulation of cellular metabolism Bioinformatics III
KEGG database The KEGG PATHWAY database (http://www.genome. jp/kegg/pathway.html) is a collection of graphical diagrams (KEGG pathway maps) representing molecular interaction networks in various cellular processes. Each reference pathway is manually drawn and updated with the notation shown left. Organism-specific pathways (green-colored pathways) are computationally generated based on the KO assignment in individual genomes. Bioinformatics III
Citrate Cycle (TCA cycle) in E.coli Bioinformatics III
Citrate Cycle (TCA cycle) in different organisms Citrate cycle (TCA cycle) - Escherichia coli K-12 MG1655 Citrate cycle (TCA cycle) - Helicobacter pylori 26695 Green/red: enzyme annotated in this organism Bioinformatics III
EcoCyc Database E.coli genome contains 4.7 million DNA bases. How can we characterize the functional complement of E.coli and according to what criteria can we compare the biochemical networks of two organisms? EcoCyc contains the metabolic map of E.coli defined as the set of all known pathways, reactions and enzymes of E.coli small-molecule metabolism. Analyze - the connectivity relationships of the metabolic network - its partitioning into pathways - enzyme activation and inhibition - repetition and multiplicity of elements such as enzymes, reactions, and substrates. Ouzonis, Karp, Genome Res. 10, 568 (2000) Bioinformatics III
Glycolysis in E.coli Blue arrows: biochemical reactions clicking on arrow shows responsible enzyme + and - : activation and inhibition of enzymes www.ecocyc.org Bioinformatics III
Regulation of Glycolysis in E.coli Boxed genes on the left are enzymes of glycolysis pathway pgi: phosphoglucose isomerase pgk: phosphoglycerate kinase pfk: 6-phosphofructo kinase ... Circled FruR, CRP etc. on the right : transcription factors Green pointed arrows: activation of transcription; Violet blunt arrow : repression; Brown circle-ended arrow indicates that the factor can activate or repress, depending on circumstances. www.ecocyc.org Bioinformatics III
Pentose Phosphate pathway Blue arrows: biochemical reactions clicking on arrow shows responsible enzyme + and - : activation and inhibition of enzymes www.ecocyc.org Bioinformatics III
Regulation of Pentose Phosphate Pathway www.ecocyc.org Bioinformatics III
TCA cycle www.ecocyc.org Bioinformatics III
Regulation of TCA cycle www.ecocyc.org Bioinformatics III
EcoCyc Analysis of E.coli Metabolism In 2000, E.coli genome contained 4391 predicted genes, of which 4288 coded for proteins (4503 genes in Dec. 2011, 209 RNAs). 676 of these genes form 607 enzymes of the E.coli small-molecule metabolism. Of those enzymes, 311 are protein complexes, 296 are monomers. Organization of protein complexes. Distribution of subunit counts for all EcoCyc protein complexes. The predominance of monomers, dimers, and tetramers is obvious Ouzonis, Karp, Genome Res. 10, 568 (2000) Bioinformatics III
Reactions EcoCyc describes 905 metabolic reactions that are catalyzed by E. coli. (1991 in Dec. 2011) Of these reactions, 161 are not involved in small-molecule metabolism, e.g. they participate in macromolecule metabolism such as DNA replication and tRNA charging. Of the remaining 744 reactions, 569 have been assigned to at least one pathway. Ouzonis, Karp, Genome Res. 10, 568 (2000) Bioinformatics III
Reactions The number of reactions (744) and the number of enzymes (607) differ ... WHY?? (1) there is no one-to-one mapping between enzymes and reactions – some enzymes catalyze multiple reactions, and some reactions are catalyzed by multiple enzymes. (2) for some reactions known to be catalyzed by E.coli, the enzyme has not yet been identified. Ouzonis, Karp, Genome Res. 10, 568 (2000) Bioinformatics III
Compounds The 744 reactions of E.coli small-molecule metabolism involve a total of 791 different substrates. On average, each reaction contains 4.0 substrates, (think of A + B <-> C + D) Number of reactions containing varying numbers of substrates (reactants plus products). Ouzonis, Karp, Genome Res. 10, 568 (2000) Bioinformatics III
Compounds Each distinct substrate occurs in an average of 2.1 reactions. Ouzonis, Karp, Genome Res. 10, 568 (2000) 14. Lecture WS 2013/14 Bioinformatics III
Pathways EcoCyc describes 131 pathways (347 in Dec. 2011): energy metabolism nucleotide and amino acid biosynthesis secondary metabolism Pathways vary in length from a single reaction step to 16 steps with an average of 5.4 steps. Length distribution of EcoCyc pathways Ouzonis, Karp, Genome Res. 10, 568 (2000) Bioinformatics III
Pathways However, there is no precise biological definition of a pathway. The partitioning of the metabolic network into pathways (including the well-known examples of biochemical pathways) is somehow arbitrary. These decisions of course also affect the distribution of pathway lengths. Ouzonis, Karp, Genome Res. 10, 568 (2000) Bioinformatics III
Enzyme Modulation An enzymatic reaction is a type of EcoCyc object that represents the pairing of an enzyme with a reaction catalyzed by that enzyme. EcoCyc contains extensive information on the modulation of E.coli enzymes with respect to particular reactions: - activators and inhibitors of the enzyme, - cofactors required by the enzyme - alternative substrates that the enzyme will accept. Of the 805 enzymatic-reaction objects within EcoCyc, physiologically relevant activators are known for 22, physiologically relevant inhibitors are known for 80. 327 (almost half) require a cofactor or prosthetic group. Ouzonis, Karp, Genome Res. 10, 568 (2000) Bioinformatics III
Enzyme Modulation Ouzonis, Karp, Genome Res. 10, 568 (2000) Bioinformatics III
Reactions catalyzed by more than one enzyme Diagram showing the number of reactions that are catalyzed by one or more enzymes. Most reactions are catalyzed by one enzyme, some by two, and very few by more than two enzymes. For 84 reactions, the corresponding enzyme is not yet encoded in EcoCyc. What may be the reasons for isozyme redundancy? (1) the enzymes that catalyze the same reaction are paralogs (homologs) and have duplicated (or were obtained by horizontal gene transfer), acquiring some specificity but retaining the same mechanism (divergence) (2) the reaction is easily „invented“; therefore, there is more than one protein family that is independently able to perform the catalysis (convergence). Ouzonis, Karp, Genome Res. 10, 568 (2000) Bioinformatics III
Enzymes that catalyze more than one reaction Genome predictions usually assign a single enzymatic function. However, E.coli is known to contain many multifunctional enzymes. Of the 607 E.coli enzymes, 100 are multifunctional, either having the same active site and different substrate specificities or different active sites. Number of enzymes that catalyze one or more reactions. Most enzymes catalyze one reaction; some are multifunctional. The enzymes that catalyze 7 and 9 reactions are purine nucleoside phosphorylase and nucleoside diphosphate kinase. The high proportion of multifunctional enzymes implies that the genome projects may significantly underpredict multifunctional enzymes! Ouzonis, Karp, Genome Res. 10, 568 (2000) Bioinformatics III
Reactions participating in more than one pathway The 99 reactions belonging to multiple pathways appear to be the intersection points in the complex network of chemical processes in the cell. E.g. the reaction present in 6 pathways corresponds to the reaction catalyzed by malate dehydrogenase, a central enzyme in cellular metabolism. Ouzonis, Karp, Genome Res. 10, 568 (2000) Bioinformatics III
Large-scale structure: Metabolic networks are scale-free Attributes of generic network structures. a, Representative structure of the network generated by the Erdös–Rényi network model. b, The network connectivity can be characterized by the probability, P(k), that a node has k links. For a random network P(k) peaks strongly at k = <k> and decays exponentially for large k (i.e., P(k) e-k for k >> <k> and k << <k> ). c, In the scale-free network most nodes have only a few links, but a few nodes, called hubs (dark), have a very large number of links. d, P(k) for a scale-free network has no well-defined peak, and for large k it decays as a power-law, P(k) k-, appearing as a straight line with slope - on a log–log plot. Jeong et al. Nature 407, 651 (2000) Bioinformatics III
Connectivity distributions P(k) for substrates a, Archaeoglobus fulgidus (archae); b, E. coli (bacterium); c, Caenorhabditis elegans (eukaryote) d, The connectivity distribution averaged over 43 organisms. x-axis: metabolites participating in k reactions y-axis (P(k)): number/frequency of such metabolites log–log plot, counts separately the incoming (In) and outgoing links (Out) for each substrate. kin (kout) corresponds to the number of reactions in which a substrate participates as a product (educt). Jeong et al. Nature 407, 651 (2000) Bioinformatics III
Properties of metabolic networks a, The histogram of the biochemical pathway lengths, l, in E. coli. b, The average path length (diameter) for each of the 43 organisms. N : number of metabolites in each organism c, d, Average number of incoming links (c) or outgoing links (d) per node for each organism. e, The effect of substrate removal on the metabolic network diameter of E. coli. In the top curve (red) the most connected substrates are removed first. In the bottom curve (green) nodes are removed randomly. M = 60 corresponds to 8% of the total number of substrates in found in E. coli. b–d, Archaea (magenta), bacteria (green) and eukaryotes (blue) are shown. Jeong et al. Nature 407, 651 (2000) Bioinformatics III
Interpretation of metabolic network connectivity Despite significant variations in their individual constituents and pathways, the metabolic networks of 43 organisms representing all 3 domains of life have the same topological scaling properties and show striking similarities to the inherent organization of complex non-biological systems. Jeong et al. Nature 407, 651 (2000) Bioinformatics III
Development of the network-based pathway paradigm (a) With advanced biochemical tech-niques, years of research have led to the precise characterization of individual reactions. As a result, the complete stoichiometries of many metabolic reactions have been characterized. (b) Most of these reactions have been grouped into `traditional pathways' (e.g. glycolysis) that do not account for cofactors and byproducts in a way that lends itself to a mathematical description. However, with sequenced and annotated genomes, models can be made that account for many metabolic reactions in an organism. (c) Subsequently, network-based, mathematically defined pathways can be analyzed that account for a complete network (black and gray arrows correspond to active and inactive reactions). Papin et al. TIBS 28, 250 (2003) Bioinformatics III
Stoichiometric matrix Stoichiometric matrix: A matrix with reaction stochio-metries as columns and metabolite participations as rows. The stochiometric matrix is an important part of the in silico model. With the matrix, the methods of extreme pathway and elementary mode analyses can be used to generate a unique set of pathways P1, P2, and P3 (see future lecture). Papin et al. TIBS 28, 250 (2003) Bioinformatics III