Download
1 / 19
200 likes | 470 Views
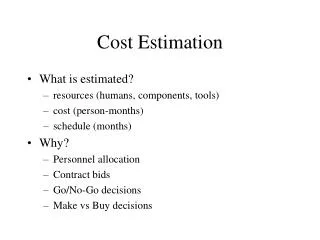
Module 14 Cost Behavior and Cost Estimation. Introduction. What is the nature of costs and how are they used in decision making? Do they increase or decrease as production volume changes? Do they remain stable? How can we use cost behavior to predict future costs?.

E N D
Introduction What is the nature of costs and how are they used in decision making? Do they increase or decrease as production volume changes? Do they remain stable? How can we use cost behavior to predict future costs?
The Behavior of Fixed Costs Fixed Costs remain the same in total, but may vary per unit when production volume changes. Examples: Rent, Depreciation, Salary of a Plant Manager, Insurance, Property Taxes Fixed Cost Per Unit $ $ Total Fixed Costs 4 100 2 1.33 50 25 75 25 50 75 Volume Volume
The Behavior of Variable Costs Variable Costs vary in direct proportion to changes in production volume, but are fixed when expressed as per-unit amounts.Examples: Direct material, some direct labor, and other unit-level costs like factory supplies. $ Total Variable Costs Variable Cost Per Unit $ 150 100 2 50 0 25 50 25 50 75 75 Volume Volume
Curvilinear Costs and the Relevant Range Relevant Range Cost Curvilinear Function Straight-Line Approximation Volume
Costs Within the Relevant Range Within the relevant range: Total fixed costs are constant. Fixed cost per unit decreases as units increase. Total variable costs increase as units increase. Variable cost per unit is constant. Use the constant measures to create a linear relationship.
Mixed Costs (Fixed and Variable) Cost Variable Fixed 00 Volume
The Cost Equation(for mixed costs) Y = a + bX Y= total costs. a= total fixed costs (intercept of line). b= variable cost per unit (slope of line). X= units produced.
Cost Behavior and Decision Making For Pizza Pete’s: Assume that direct materials were $2 per pizza, direct labor was $1.50 per pizza, and variable overhead was $1.00 per pizza, and that $6,300 is fixed overhead. What would be the cost of goods sold (1) for 2,600 pizzas? (2) for 1,000 pizzas?
Cost Behavior and Decision Making 2,600 1,000 Direct materials Direct labor Variable OH Fixed OH Total COGS COGS per Unit $2.00 $1.50 $1.00 $ 2,000 1,500 1,000 6,300 $10,800 $5,200 3,900 2,600 6,300 $18,000 $6.92 $10.80 Alternative – use formula: Y = a + bX
Mixed Costs Fixed and Variable Components of Pizza Pete’s: Fixed: lease payment each month. Variable: pizza components, wages, electricity, etc., that vary with the number of deliveries made (and miles driven).
Separating Mixed Costs into their Fixed and Variable Components • High-Low Method: an algebraic technique of solving for the slope (variable cost per unit) and intercept (fixed costs) of a line, by using the high and low observations (coordinates) of the line. • Regression Analysis: A statistical technique used to estimate the slope (VCU) and intercept (FC) components of a mixed cost is called least squares regression. Regression analysis uses statistical methods to fit a cost line (regression line) through a set of points which minimizes the sum of the squared distance from each data point to the line (hence the name least squares regression).
Estimating Slope and Intercept Using the High-Low Method 1. Use only two data points, the high and low levels of activity and their related total overhead costs. 2. Subtract the smallest from the largest for each and use the changes in the following formula. 3. Change in Cost = Variable cost per unit Change in volume
Estimating Slope and Intercept Using the High-Low Method 4. Substitute the total cost and activity of one of the points for “y” and “x” in the equation y = a + bx . 5. Substitute the variable cost found using high-low for “b” . 6. Solve for fixed costs “a” . 7. Determine the formula to use in estimating the mixed costs at various levels .
Estimating Slope and Intercept Using the High-Low Method Example: 1. High Point = 2,500 units at $12,450 Low Point = 1,950 units at $10,525 2. 2,500 - 1,950 = 550 units (change in units) $12,450 - $10,525 = $1,925 (change in cost) 3. $1,925 / 550 units = $3.50 variable cost/unit
Estimating Slope and Intercept Using the High-Low Method Steps 4,5,6 Y = $12,450 = $12,450 = $3,700 = Y = a + bx a + $3.50 (2,500) a + $8,750 a $3,700 + $3.50x Volume at high pt Cost at high pt Variable Costs Fixed Costs 7. Y = $3,700 + $3.50 (X) (formula to use to estimate costs)
Least Squares Regression Analysis Regression Line = Total Overhead Cost Slope represents the change in $ for a 1 unit change in volume Total Costs ? $ Slope of Regression Line = Variable Cost per unit Fixed Cost 1 unit Volume
Regression Statistics Benefits of regression: Uses all of the observations, not just high and low. Resulting measures offer insight into the quality of the output. R2 (r-squared) indicates the goodness of fit for the model. Range between 0 and 1, a high R2 indicates that the relationship between the independent variable and the dependent variable explains most of the change in cost. Problem: output may indicate a relationship, even when there is no relationship.
Using a Spreadsheet Program to Perform Regression Analysis Using the actual values of the mixed costs (dependent variable) and the volume of production (independent variable) and a spreadsheet program such as Excel, you can compute a regression line using least squares regression.