Download
1 / 35
350 likes | 441 Views
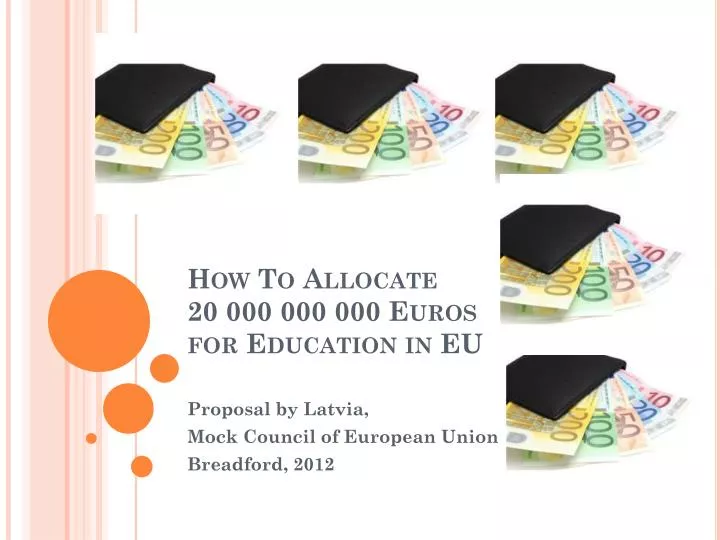
How To Allocate 20 000 000 000 Euros for Education in EU. Proposal by Latvia, Mock Council of European Union Breadford, 2012. Latvia together with other member states in one picture . smile ! say cheese ! can you find where is it?.

E N D
How To Allocate20 000 000 000 EurosforEducationin EU Proposal by Latvia, Mock Council of European Union Breadford, 2012
Latviatogetherwithothermemberstatesinonepicture. smile! saycheese!canyoufindwhereis it?
Task 1allocatethemoneyprportionally to eachmemberstatebasedonpopulationsize? Would this really bring effective results in education in all of the member states?
To our mind, allocating money according only to the population would not lead to a sufficient and sustainable result in education systems in EU. • Even if it could suit our bigger members , like Belgium, UK, France, Germany , etc., total ignorance of the latest changes in data on immigration, emigration, employment and density in each state lead to a total ignorance of recent problems in education in EU.
Let’ s takelatviaasanexample!little strokes fell great oaks.A littleknollmakes a largecartfall.( latvianversionofEnglishsaying, photobykarmenabaranovska) • ThehighrateofemigrationfromLatvialatelytends to belike a hiddenstumblingblock to Latvianeducationsystem.
ThePopulationinLatviaisDecreasingRapidly 2270894 – in 2008 2261294 – in 2009 2248374 – in 2010 2229641- in 2011 Choir Sp’īgo in Latvia Song and Dance Festival
A smallCommentonpreviousData • Latvia Central Statistical Bureau has recently informed EU, on March 1, 2011 in Latvia were 2 074 605 persons. • In comparison with data published prior in February, 2011 at Eurostat (based on population Register data), it has the number of population reduced for155 000. • The population in Latvia has decreased for about 309 thousands or 13% since the previous population census in 2000.
GreatBritainandIrelandarestateswhereisthelargestnumberofLatviansabroadabout70 000 Latviansin UK, but20 000 inIreland. Thatmakesabout43% ofLatviansabroad. www. neogeo. lv EmmigrationexceedsimmigrationinLatvia. LatviansGo to Ireland, UK, Germany, Sweeden, Denmark, NorwaySearchingforJobs.
Populationchangesatourschool • There are 986 students at our school. • Parents of 30 students live abroad. • 30% of students live with one of the parents, with their grandparents, with foster parents or a guardian.
WhydoTheyHave to go? According to Eurostat’s provisional data, in 2010, 10702 people emigrated from Latvia Mostfrequentanswers: • to makeendstogether • to earnmoneyforpayingcredits to banks • to starttheirbusinessabroadorinLatvia • to earnmoneyfortheirstudies • to betogetherwiththeirfamilymembers
Nowthereis a recenttendency: latviansapplyformorehiglyqualifiedjobs • Due to theeconomyoffinancialresources to payfinancialdebtWorldbank • Manyhospitalsandmedicalinstitutionsareclosed • Smallschools, especiallyprimaryandvocational, areclosedforbeingnoneffective; • Privatecompanies, especiallyfarms, constructionenterprisesbankruptorarereorganized • Consumerservicecompanies, likehairdressers, beautyandfashiondesignerscloseuporchangetheirplace • Cafeterias, restaurantsandfurnitureshopschangetheirlocationandgoabroad
ChildrenareleftBehindAtSchoolsinLatvia. sometimestheyhave to goabroadwiththeirfamiliesandtheyinterrupttheireducationforsometimeandstart it backagainabroad. • NumberofdivorcedfamiliesinLatviaisincreasingrapidly • Childrenhave to staywiththeirgrandparents, theirrelativesorfriendsoftheirfamilies • Qualityofeducationdecreases, becauseofthedespairandthelowsuccessofthelittle students leftbehind
WhileintheOtherMemberStates • Immigration exceeds emmigration • There is a severe competence that forces residents to go abroad or receive unemployment insurances • People from Latvia tend to gain citizenship abroad. With this, they can receive unemployment insurances and other social benefits abroad that are significantly bigger than in Latvia.
Task2 Allocatethemoneybasedupontheunemploymentfigures The grater the unemployment, the grater the need to promote economic growth
WhatcouldLatviadowiththemoneyallocated to educationonbasisofunemployment? • allocate some funds for vocational training at elderly classes of elementary school and secondary school; • raise our teacher salaries; • allocate money for student enterprises; • develop the education of interest; • create places of practice making contracts with different enterprises in Latvia
WhatwouldberesultsinLatvia? • afterthelessons students wouldpracticeinthebranchoftheirinterest ; • students wouldtryoutdifferentbranchesthatwouldhelpedthem to findtheirpathintheirlives; • students wouldhave a littlepracticeinthebranchoftheirfutureprofession;
Butagain, wouildnot it belike a strugglewith a windmill? • The money is divided without taking into account the number of population in larger member states. • A significant part of the unemployed in countries with more imigrants than emigrants is made by immigrants.
Ineducationthatwouldmean: Teachers have to struggle with students : • who have different cultural and religious backgrounds; • who havedifferent lagguage of their knowledge because educational systems are slightly different across the European Union and very different across all the world;
Task 3Allocatethe Money baseduponaverageageofpopulation The younger the population the greater the need for investment in education
Due to economicmigration, lowfertilitypopulationinlatviaisageing Latvian CSB after the last population Census: The average age in Latvia is 41.6 “Population and Housing Census approves that economic migration and low fertility has led to population ageing. On 1 January 2011 the average age was 41.6 years - 6 moths more than the average age published earlier. ”ALDIS BROKĀNS, ADDITIONAL INFORMATION PRESS OFFICER AT CENTRAL STATISTICAL BERAU OF LATVIA HTTP: //WWW.CSB.GOV.LV/EN/PRINT/34509
TABLE OF DATA providedrecentlybyCentralstatisticalBerauinLatvia
Themostnotablereductioninthepopulationnumberwasrecordedin 23-31 yearagegroup(morethan 14%).LatvianCentralStatisticalBureauafterthelastPopulationandHousingCensus • “ Thedecreasemaybeexplainedwithdifficulties to findemploymentinLatviaafterschoolforcingyoungpeople to leavethecountrywithanaim to findworkabroad.” • Sothemoneyallocatedfrom EU to educationwouldsolveatleastsomeofthedemographicproblemsinLatvia. Aldis Brokans, PressOfficerofLatvia CSB
The bravest representatives from different companies and enterprases in Jelgava make boats and floats out of used milk cartons and float on them on Lielupe during Milk and Honey Festival in summer. It is a great fun. Milkandhoneyfestivalinjelgava
ShortDescriptionofDataUsedinPresentation • The data are taken from Eurostat 21 Apr 2012. • The inhabitants of a given area on 1 January of the year in question (or in some cases, on 31 December of the previous year). • The population is based on data from the most recent census adjusted by produced since last census, or based on population registers.