Download
1 / 9
90 likes | 167 Views
Predicting and Valuing Default. Approaches. Empirical Method. Relies on financial/accounting data. Picks up patterns in history: what accounting.structures prevail before defaults? Structural Method. Relies on Stock Market data. Variations on the seminal Merton Model. Reduced Form Method.

E N D
Approaches • Empirical Method. • Relies on financial/accounting data. • Picks up patterns in history: what accounting.structures prevail before defaults? • Structural Method. • Relies on Stock Market data. • Variations on the seminal Merton Model. • Reduced Form Method. • Relies on Bond Market data. • Relativistic framework (a la BDT for IR modeling).
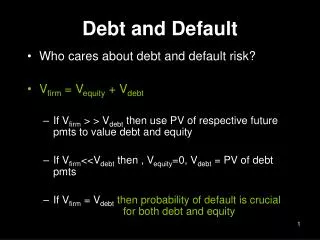
Empirical Method Failures The Enron and Worldcom bankruptcies in 2001 highlight a fundamental problem with the empirical method. It is backward looking--both in terms of patterns relating accounting data to default and in terms of the actual data itself. Moodys Case Studies: • Enron • Worldcom • Bally's
Market-Adjusted Ratings Moody’s notes that the standard bond ratings process may not be as accurate or timely as market-based information. They now market a product called Market Implied Ratings (MIR): Moodys MIR
Structural Model in Practice Merton’s model (also known as the Black-Scholes Model) is the benchmark structural model. All of the relevant information about the default risk of the company, and the price of that risk is contained in the stock market. In practice, the Moodys KMV model is probably the most widely used variant. While the KMV model is proprietary, much has been written about it by Moodys economists.
KMV Features • The benchmark riskfree rate is the swap curve--not the Treasury curve. • There is time-varying market risk premium. • There is a liquidity premium based on the firm’s access to capital markets. • Expected Recovery is time-varying. • Equity is treated as a perpetual down-and-out option on the firm’s assets. • Bankruptcy trigger is a percentage (e.g., 70%) of total firm liabilities. • The translation from the EqRNW default probability to the physical probability is made by comparing the two historically.
Reduced Form Model A popular reduced form model is that of Hull and White. The term structure of EqRNW default probabilities is obtained from a series of Corporate and Treasury bonds. Example: 5-Year 0-coupon Treasury yields 5%. 5-Year 0-coupon Corporate yields 5.5% T = 100 exp(-.05 5) = 77.8801 C = 100 exp(-.055 5) = 75.9572 PV of cost of default = $1.9229. If we assume 0 recovery on default, then: 100 (p) (exp(-.05 5) = 1.9229, where p is the EqRNW probability of default. p = 2.47%.
Hull White Model Since there few 0-coupon corporates, the implementation of the model entails bootstrapping both the Treasury and Corporate yield curves. Also, recovery is not 0, so the recovery rate would be estimated using relevant historical data.
Comparing Models Here’s a link to a 2005 study from KMV that compares the Merton, Moodys KMV, and Hull-White models in terms of their ability to explain Credit Default Swap spreads. It is intriguing that the KMV model -- which uses stock market information--does a better job than the Hull and White model which uses bond market information.