Download
1 / 20

E N D
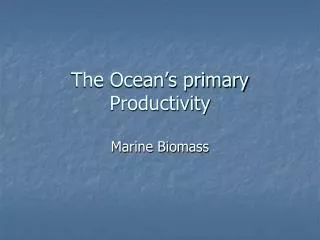
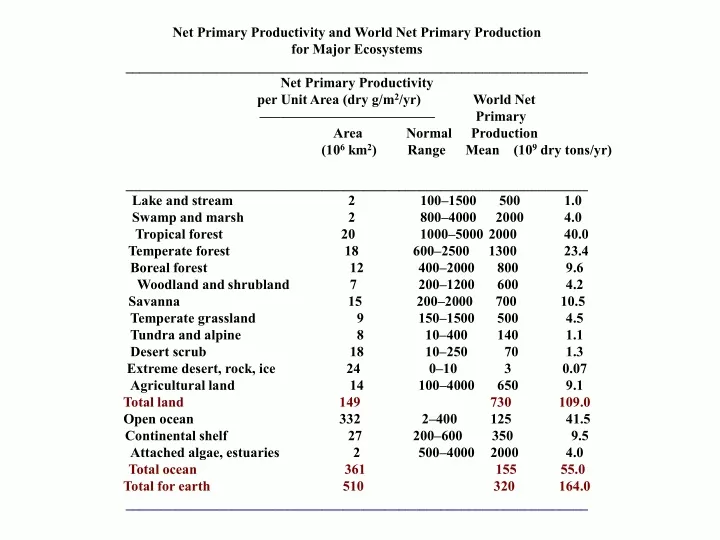
Net Primary Productivity and World Net Primary Production for Major Ecosystems __________________________________________________________________ Net Primary Productivity per Unit Area (dry g/m2/yr) World Net ––––––––––––––––––––––––– Primary Area Normal Production (106 km2) Range Mean (109 dry tons/yr)__________________________________________________________________ Lake and stream 2 100–1500 500 1.0Swamp and marsh 2 800–4000 2000 4.0 Tropical forest 20 1000–5000 2000 40.0 Temperate forest 18 600–2500 1300 23.4Boreal forest 12 400–2000 800 9.6 Woodland and shrubland 7 200–1200 600 4.2Savanna 15 200–2000 700 10.5Temperate grassland 9 150–1500 500 4.5Tundra and alpine 8 10–400 140 1.1Desert scrub 18 10–250 70 1.3Extreme desert, rock, ice 24 0–10 3 0.07Agricultural land 14 100–4000 650 9.1Total land 149 730 109.0Open ocean 332 2–400 125 41.5Continental shelf 27 200–600 350 9.5Attached algae, estuaries 2 500–4000 2000 4.0Total ocean 361 155 55.0Total for earth 510 320 164.0__________________________________________________________________
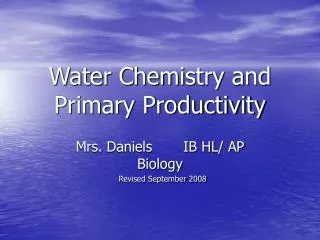
Potential Evapotranspiration (PET)theoretical temperature-dependentamount of water that could be “cookedout” of an ecological system, given itsinput of solar energy and provided that much water fell on the areaActual Evapotranspiration (AET)“reverse of rain” actual amount of water returned to the atmosphere(always less than or equal to PET)
During a period of water surplus, some water may be stored by plants and some may accumulate in the soil as soil moisture, depending on runoff and the capacity of soils to hold water; during a later water deficit, such stored water can be used by plants and released back into the atmosphere. Winter rain is generally much less effective than summer rain because of the reduced activity (or complete inactivity) of plants in winter; indeed, two areas with the same annual march of temperature and total annual precipitation may differ greatly in the types of plants they support and in their productivity as a result of their seasonal patterns of precipitation. An area receiving about 50 cm of precipitation annually supports either a grassland vegetation or chaparral, depending on whether the precipitation falls in summer or winter, respectively.
6 CO2 + 12 H2O ——> C6H12O6 + 6 O2 + 6 H2Ocarbon + water ——> Glucose + oxygen + water dioxideCO2 fairly constant at about 0.03 - 0.04 percent of air (anthropogenic increase) (CO2 seldom limits the rate of photosynthesis, usually it is limited by availability of either light or water)
Pedogenic Factors Climate Time Topography Organisms (especially vegetation) Parent materials V. V. Dokuchaev
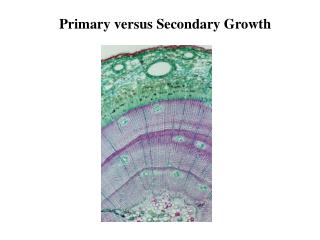
Serpentine soils form over serpentine rock.Rich in magnesium, chromium, and nickel.Contain little calcium, nitrogen, or phosphorus.Support a stunted vegetation(low productivity)Introduced Mediterranean weeds in CaliforniaPrimary succession is the development of soils from bare rock, a slow process that takes centuries.
Tropical soilsLitter fall high, but decomposes rapidlyHigh rainfall leaches out water soluble nutrientsNutrient poor soils cannot sustain agricultureSlash and burn, move on …strategySecondary succession on mature soilsRapidly growing colonizing species give way to slow growing, shade tolerant, climax species
One to one correspondence between climate, vegetation, and soils
Bathythermographs High Specific Heat of Water Heaviest at 4° C ( ice floats ) Eutrophic Lakes Oligotrophic Lakes Isothermal at Spring and Fall Turnover
Vertical Diurnal Migration of Freshwater Phytoplankton and Zooplankton
Tolerance Curves Principle of Allocation
Resource Budgets Principle of Allocation Time, Matter, and Energy Budgets Rock PipitsAnthus spinoletta Mild Winter versus Harsh Winter Feeding: 6.5 hours vs. 8.25 hours Resting: 1.75 hours vs. 0.6 hours Fighting: 0.75 hours vs. 0.1 hour