Download
1 / 100
1k likes | 1.01k Views
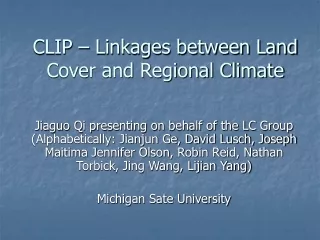
CLIP Climate-Land Interaction Project. US: Campbell, Alagarswamy, Andresen, Heubner, Lofgren, Lusch, Moore, Olson, Pijanowski, Qi East Africa: Magezi, Maitima, Misana, Mugisha, N’ganga, Reid, Thornton,Yanda UK: Conway, Doherty, Hansen, Palutikof. University of Nairobi.

E N D
CLIPClimate-Land Interaction Project US: Campbell, Alagarswamy, Andresen, Heubner, Lofgren, Lusch, Moore, Olson, Pijanowski, Qi East Africa: Magezi, Maitima, Misana, Mugisha, N’ganga, Reid, Thornton,Yanda UK: Conway, Doherty, Hansen, Palutikof University of Nairobi
Overarching Research Question What is the nature and magnitude of the interaction between land use and climate change at regional and local scales?
Global Climate CLIMATE DYNAMICS Regional Local NPP SIMULATIONS LAND COVER INTEGRATIVE Spatial and temporal scales Uncertainty analysis Feedbacks and tipping points Systems paradigms Broader impacts Case Studies Remote Sensing Crops Rangeland LAND USE CHANGE Role Playing Games Case Studies Models Human Systems The Climate-Land “Loop”
Key Points • There are human, technical and scientific challenges to addressing this question • Human • “Change is Good” • For researchers to work together, everyone needs to adjust their practice of science to contribute toward knowledge gaps that require social and biophysical bridges • “Sacrifice for the Good of the Whole” • Individual researchers often sacrifice advancing their own field in order to fill the gaps • Younger researchers need to demonstrate productivity and they are making the greatest sacrifices • “The Big Picture” • System-wide, “big science” questions (e.g., scale, uncertainty, nature of feedbacks) engage all participants and infuse a sense of intellectual community for all • “Working is Groups is Hard” • Different personalities require psychological adjustments • Everyone is busy, “buried” and contributing at high levels and long term is difficult and exhausting
Key Points • Technical Points • “Get Out of Our Box” • Getting models to “talk to one another” is not easy, researchers are still embroiled in technical aspects of how to run their own model in isolation of the system of models • “The Cyber Challenge!” • Complex models require cyberinfrastructure which is not easy to use; these resources are in demand by all scientists (e.g., physicists running models on the ‘big bang’) • “Talk Isn’t Cheap” • Communication is hard, needs to be frequent for progress to happen • “We All Do it Differently” • Need to address cultural issues in a project composed of many researchers from all over the world. What we each consider as important science differs (basic/applied) • “Data data is everywhere but not a drop to drink” • The data you need is not available but many other surrogates exist that help you to synthesize what you could use
Key points • Scientific • “Think Big” • Our overarching question has imbedded many “grand challenge questions” in nearly all natural and social sciences (e.g., scale, representation, uncertainty) • “Figure 1” is key, it ground us all to the project • “Start Simple” • Get our “version 1” products to our colleagues quickly • “We all come up Short” • None of us are experts of the entire system of knowledge, methods, etc • “Getting Religion” • We need to “blend” practices of science in order to make progress (biophysical scientists have a lot to learn from social scientists that can improve their science through different practices” • “Coming with a Bias” • We all have a different impression of what each of us does, sometimes it is not flattering what other disciplines think about each other…especially true of natural science bias of social science (“it is soft and not quantitative and therefore not precise”) • “Leadership is Key” • We need leadership which has to be shared across subthemes and over time • Provides a common foundation for meeting project timelines • “The Story Line” • Translating the narrative story into a model is not easy
Presentation • Examples of addressing technical and scientific challenges • How we are completing the loop (it has never been done)
Extent of Analysis: Kenya, Tanzania, Uganda, plus Rwanda, Burundi and parts of 6 other countries. Need to use datasets and models at different scales! Case studies Patterns Drivers Agents
Multiple Methods LAND USE • Long term field work in 8 LUC case study sites: Household surveys, group interviews, LUC analysis, vegetation species counts, soil sampling, wildlife counts, etc. (LUCID project): historical LUC drivers and patterns • Expert system analysis, role play: future drivers and patterns • Land use modeling (LTM) • Agent based modeling (MABEL) LAND COVER • Remote sensing: land surface parameters CLIMATE • Statistical analysis of meteorological data: historical trends • Comparison of GCM output for region • Regional climate model (RAMS): scenarios under different LULC NET PRIMARY PRODUCTIVITY • Crop-climate (CERES-Maize & others) • Natural vegetation-climate (LPJ model) Uncertainty analyses
But high variability in land uses, covers. Example: agriculture Delmonte pineapple Rice paddy Tea plantation
Small scale mixed crop, livestock and agro-forests (90% of all ag. land) Ivondo
Challenge: calibrating models, global datasets to East African situation • Needed to choose, or create a “best available” baseline land cover Statistical analysis of variability within & between cover classes of 3 classifications (“M” statistic) Use of “ground truthing” information from aerial videography and case studies Result: hybrid of FAO’s Africover (urban and ag. classes) and GLC2000 (natural veg. classes), called “CLIPcover.”
Challenge: calibrating models, global datasets to East African situation 2. Critical lack of long-term, consistent meteorological data. Stations tend to be clustered in wetter areas, almost absent in semi-arid zones. Much missing data. Insufficient radiosonde data.
Approach: Conduct historical trends analysis within study sites, weather generator. Use new CRU gridded dataset for crop-climate & LUC modeling.
Cloud cover is our best proxy for spatial rainfall distribution Used TRMMS satellite data to initialize RAMS
Challenge: calibrating models, global datasets to East African situation 3. Generic, “look-up table” of land cover parameters such as albedo and leaf area index (LAI) in RAMS are different from our region, yet these parameters are critical for our research question. East Africa is drier and has more seasonal variation in vegetation than look up table values would indicate.
RAMS’ LAI phenological curves vs. observed (MODIS) LAI Curves So, calculated new phenological LAI curves from MODIS data with polynominal splines for each land cover class at altitudinal belts. The red dotted curves are phenologies at the equator, green solid curves are for north 5 degree, the blue dashed curves for south 5 degree, and the black dot-dashed line is the zero comparison line.
Did it make any difference? • LAI shown in: • RAMS default land cover, and default cover parameters. • CLIPcover, with default land cover parameters. • CLIPcover with new spline functions • MODIS observed LAI for that period. • Conclusion: YES, it made a difference!
Challenge: calibrating models, global datasets to East African situation 4. For land use modeling: Limited spatial data, especially socio-economic, that covers the entire study domain, yet high spatial and temporal variability in patterns and drivers. Policy is a major driver, and changes often. Migration from distant areas an important driver in some places. Some drivers, such as war, result in reverses of LUC with land abandonment. Need to learn of future drivers and patterns beyond historical trends, from people who would know.
Modeling Scales and Direction SOURCE SCALE Global “Top down” IPCC/GTAP Regional Country “Bottom up” Experts/ Demography Potential Homogenous Zones LTM District Town MABEL Case Studies RPS/Case Studies Family/Farm Individual/Pixel Resolve
Role Playing Simulation: Kenya How do farmer and herder groups decide who gets what land? How do they respond to government mandates? What is the land use outcome of the competition over land? Representatives from the Kenya Government and universities
Land Use Expert Workshop: Tanzania Representatives from the government and from academic units at UDSM, NSF • Major LUC is expected in certain zones due to: • Transport infrastructure development: roads, bridges • Government’s agricultural modernisation policy • Growth of urban market for fuelwood, meat, milk and crop production • Structural adjustment • Rural migration • Sedentarisation of pastoralists. • Large role of policies—how incorporate into models?
Role Playing Simulation Constructing the Belief Network
Step 0 Prior Probabilities of the FDS Belief Network (Initial State)