Download
1 / 39
390 likes | 496 Views
Cyanobacteria in Wisconsin: Results of a Multi-Year Statewide Monitoring Program. Elisabeth Harrahy, Ph.D., Richard C. Lathrop, Ph.D. Wisconsin Department of Natural Resources Steve Geis, Dawn A. Karner, William Krick Wisconsin State Laboratory of Hygiene. Introduction. Cyanobacteria

E N D
Cyanobacteria in Wisconsin: Results of a Multi-Year Statewide Monitoring Program Elisabeth Harrahy, Ph.D., Richard C. Lathrop, Ph.D. Wisconsin Department of Natural Resources Steve Geis, Dawn A. Karner, William Krick Wisconsin State Laboratory of Hygiene
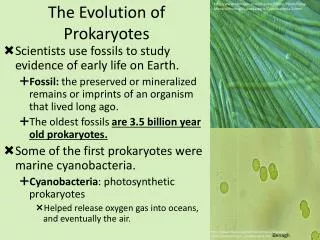
Introduction Cyanobacteria -A.K.A. blue-green algae -Differ from other bacteria: can perform photosynthesis -Differ from true algae: lack a well-defined nucleus -Make up a portion of the phytoplankton, but largely inedible Anabaena sp.
Introduction (continued) Blue-Green Algae Blooms Blue-green algae can increase in number to “bloom” densities when conditions are right: -nutrients -esp. P; some can fix N outcompete other phytoplankton -temperature -depth of water -wind -calm, low turbulence -gas-filled vesicles (most) -accumulate as scums Monona Golf Course P.
Introduction (continued) Issues Associated with Blue-Green Algae Blooms -Discolored water -Taste and odor problems -Reduced light penetration -Dissolved oxygen depletions during die-off -Toxin production
Introduction (continued) Blue-Green Algal Toxins -Some species can produce one or more toxins -Those that can produce toxins do not produce toxins at all times (strain, environmental conditions) -Reports of livestock deaths date back to 1878 -Report of human deaths in Brazil, 1996 -Controversial report of a human death here in WI, 2002 -Reports of dog deaths in WI (e.g., June 2004) Red Cedar R.
Introduction (continued) Dermatotoxins -Affect skin and mucous membranes -Can cause rashes, respiratory illness, headaches, gastrointestinal upset -Cay actually be caused by other cellular substances Hepatotoxins -Affect the liver (sometimes kidneys) -Can cause hemorrhage, tissue damage, tumors, liver cancer, death -e.g., microcystin Neurotoxins -Affect the central nervous system -Can cause seizures, paralysis, respiratory failure, death -e.g., anatoxin-a
Background on WI’s BGA Monitoring Program 2003 -Monitoring in response to finding Cylindrospermosis raciborskii -Sampled 31 eutrophic lakes -Cylindro detected in 6 lakes -Study of archived samples showed Cylindro’s presence dates back to at least 1982 -Cylindro produces two toxins and does not usually form scums Cylindrospermopsis sp.
Background on WI’s BGA Monitoring Program 2004 -While in planning stage for a repeat study, received reports of dog illnesses and deaths associated with exposure at Lake Kegonsa and Colladay Pond (early June) -A quick check showed the presence of high concentrations of Anabaena sp. -Decided to expand the monitoring program to include all species of blue-green algae that may produce toxins Edgewater Campground Lake Menomin
2004/2005 Program Objectives • To screen for the presence of BGA in select eutrophic lakes • and ponds, and determine concentrations in natural units/mL • 2. To quantify chlorophyll-a each time BGA sampled • 3. To determine concentrations of BGA in cells/mL in select • samples with high BGA screen concentrations • 4. To determine concentrations of three blue-green algal • toxins in select samples with high BGA screen • concentrations • 5. To examine relationships among concentrations of blue- • green algae, chlorophyll-a, and toxins
Sampling Design L. Kegonsa Gammon Rd. Lakes 5 lakes in each of 5 regions, 5 sample time points Ponds 8 ponds in SCR only, 5 sample time points
Sample Site Selection Criteria Lakes -eutrophic or mesotrophic -drinking water source (Rainbow and Winnebago) -beach present -used for recreation -known to have blooms in the past -not treated with herbicides L. Wingra
Sample Site Selection Criteria Ponds -eutrophic or mesotrophic -known to have blooms in the past -not treated with herbicides Natural Ponds -beach present -used for recreation Detention Ponds -located in residential area Golf Course Ponds -accessible by the public (municipal) Arbor Lakes Subdivision
Sampling Methods -Three samples were collected near shore at each location -BGA ID and enumeration (plastic, preserved) -chlorophyll-a analysis (plastic, in dark, on ice) -blue-green algal toxins analysis (amber glass, on ice) -Shipped overnight to WI State Laboratory of Hygiene
Identification and Enumeration Methods Tier I Analysis -all samples -nanoplankton chamber -rough estimate in natural units/mL Tier II Analysis -select number of samples -Utermöhl settling chamber -cells/mL and biovolume (mm3/m3)
Analytical Methods -Blue-green algal toxin analysis was performed by HPLC/MS/MS -Three toxins in one run -Report limits were 0.50 µg/L for anatoxin-a and cylindro- spermopsin, and 1.00 µg/L for microcystin-LR
Results 2004: 31 lakes 148 samples 10 ponds 38 samples 1 river 1 sample Total: 187 samples 2005: 38 lakes 154 samples 8 ponds 35 samples 1 river 5 samples Total: 194 samples (each site sampled 1 to 6 times) L. Kegonsa
Results: Blue-Green Algae 2004: BGA detected in 138/187 samples = 74% Hot spots: SCR and WCR 2005: BGA detected in 143/194 samples = 74% Hot spots: SCR and WCR L. Menomin 2004 microcystin Colladay P. 2004 & 2005 anatoxin-a
Results: Blue-Green Algae Any Broad Temporal Trends? -Cylindrospermopsis sp. was typically not detected until August or September -large blooms of Anabaena sp. detected as early as the beginning of June -large blooms of Anabaena sp., Aphanizomenon sp. and Microcystis sp. occurred throughout the summer
Results: Toxins Number of samples analyzed 2004: 45/187 samples = 24% 2005: 34/194 samples = 18% (Note: selected samples with high concentrations of BGA)
Results: Toxins Number of samples where toxins were detected 2004: 31/45 samples = 69% anatoxin-a:5/45 = 11% 1.5 – 110 µg/L cylindrospermopsin: 0/45 = 0% microcystin: 26/45 = 58% 1.2 – 7,600 µg/L 2005: 14/34 samples = 41% anatoxin-a:3/34 = 9% 0.68 – 2.7 µg/L cylindrospermopsin: 0/34 = 0% microcystin: 13/34 = 38% 1.2 – 450 µg/L
Results: Toxins 2004 Frequency of Toxin Detects Within Given Concentration Ranges 2005 Guideline Values Microcystin 1 µg/L Anatoxin-a 3 µg/L
Results: Toxins Relationship Between Toxins and Blue-Green Algae -Concentration of microcystin was not significantly correlated to the sum concentration of those species of blue-green algae (in natural units/mL, cells/mL, or mm3/m3) capable of producing microcystin (5 species). -Concentration of microcystin was significantly correlated to concentration of Microcystis sp. L. Maria
Results: Chlorophyll-a -Concentration of Chl-a ranged from 2.26 – 126,000 µg/L(!) Relationship Between Chl-a and Blue-Green Algae -In general, concentration of chl-a was significantly correlated with concentration of blue-green algae (natural units/mL, cells/mL, or mm3/m3), but r2 values were low.
Results: Chlorophyll-a Relationship Between Chl-a and Toxins -Concentration of Chl-a was significantly correlated with concentration of the toxin, microcystin. 2004 r2 = 0.98 2005 r2 = 0.31
Information Sharing -program not designed to provide real-time information -results shared with local and state public health agencies when Tier I analysis showed sum concentration BGA > 5,000 natural units/mL -sent letter and background info to public health officers -only the public health agencies have authority to close or post beaches
Information Sharing (continued) Communication Strategy a) Information on the monitoring program b) Action steps driven by monitoring results c) Agency roles and responsibilities d) How to handle citizen inquiries e) How to handle reports of illness f) How to handle media inquiries g) Contact information for key staff h) Contact information for public health officers i) Frequently asked questions j) Copy of a generic advisory sign
Information Sharing (continued) 2004 -33 alerts sent out (i.e., Tier I screens >5,000 natural units/mL) -means 18% of samples estimated to be over the WHO guideline value (100,000 blue-green algae cells/mL) 2005 -42 alerts sent out -22% of samples estimated to be over WHO value (Recall, sample sites not randomly chosen. Targeted areas where blooms may be expected to occur.)
Information Sharing (continued) Samples Counted in cells/mL (end of season) 2004 >5,000 natural units/mL: 22 20, or 91% of the 22 > 100,000 cells/mL <5,000 natural units/mL: 13 2, or 15% of the 13 > 100,000 cells/mL 2005 >5,000 natural units/mL: 25 24, or 96% of the 25 >100,000 cells/mL <5,000 natural units/mL: 9 1, or 11% of the 9 >100,000 cells/mL
Information Sharing (continued) -Toxins were frequently detected in those samples with concentrations of BGA > 5,000 natural units/mL -Toxins were also detected in a small number of samples with concentrations of BGA <5,000 (no alert sent out) Microcystin chromatogram
Information Sharing (continued) Response by Local Public Health Departments -some closed/reopened beaches -some posted advisory signs -one obtained funds to do additional sampling -all who posted used our generic advisory sign -almost all called and asked for more information
Conclusions Blue-Green Algae in Wisconsin -BGA blooms occur in all regions of the state -most severe in SCR and WCR -Concentrations of BGA frequently above the WHO value -Frequency and duration of blooms at a site varies by year -e.g., Tainter L. -Species present varies by region, and by year -e.g.,Lyngbya sp. -High concentrations of BGA and toxins detected in ponds
Conclusions Blue-Green Algae in Wisconsin -Environmental factors that trigger blooms likely include -nutrients (how nutrients affect blooms may vary by site) -role of runoff and erosion may be more important in some areas than others -e.g., Tainter Lake, 2004 vs. 2005 -e.g., Lake Kegonsa, 2004 vs. 2005 -existing sediment load -temperature -water depth -wind status
Conclusions Blue-Green Algal Toxins in Wisconsin -Anatoxin-a detected in NOR and SCR, and has been associated with dog deaths -Microcystin detected in NOR, SCR, and WCR -Environmental factors that trigger toxin production are largely unknown; likely include species and strain -Difficult to predict toxin production, but generally, when high concentrations of Microcystis sp. present, you can expect to find microcystin present -Very high concentrations of chlorophyll-a (1,000s) may indicate presence of microcystin
Conclusions Communication -received over 100 calls and e-mails from members of public -DNR staff provided the media with -4 on-camera interviews -3 talk radio show interviews -many newspaper interviews -communication strategy worked well and allowed for consistent response -5,000 natural units/mL generally a good threshold, except perhaps where have large colonies of Microcystis sp.
Research Needs -Development of threshold values or criteria for blue-green algae and their toxins (WHO values based on Microcystis sp. and microcystin toxin concentrations) -Development of analytical methods to analyze additional toxins we suspect may be present (e.g., anatoxin-as, BMAA, saxitoxin) -Studies on the effectiveness of nutrient management plans in reducing the frequency, duration, and severity of blue-green algae blooms -Studies on the persistence of toxins in water after bloom subsides -Studies on bioaccumulation of toxins by freshwater fish
Acknowledgements Kelsy Anderson Jesse Baumann Heidi Bunk Jim Cahow Diana Downes Rachel Gall Susan Graham Mark Hazuga Dan Helsel Lacey Hoyt Andy Jegerlehner Jim Klosiewski Cindy Koperski Jim Kreitlow Paul La Liberte Michelle Lehner Trent Miller Brenner Perryman Craig Roesler Ken Schreiber Lisa Schultz Greg Searle Donna Sefton Mark Sessing Linda Vogen