Download
1 / 34
340 likes | 486 Views
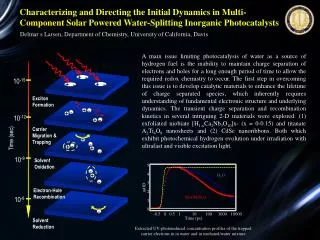
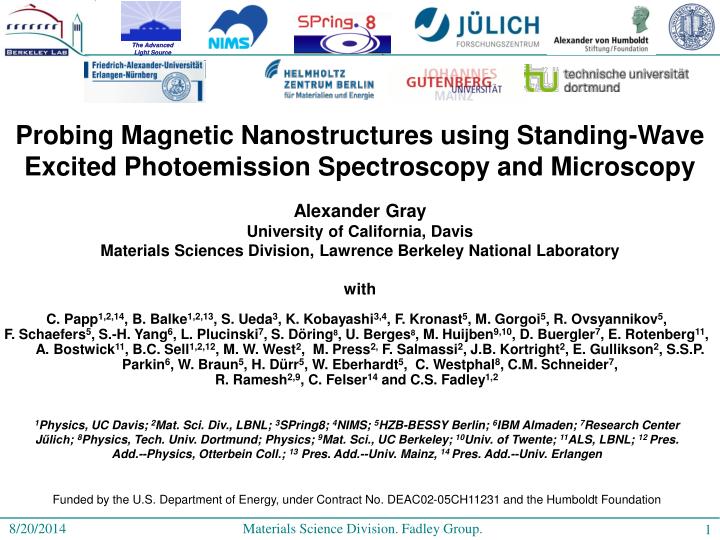
Probing Magnetic Nanostructures using Standing-Wave Excited Photoemission Spectroscopy and Microscopy. Alexander Gray University of California, Davis Materials Sciences Division, Lawrence Berkeley National Laboratory with.

E N D
Probing Magnetic Nanostructures using Standing-Wave Excited Photoemission Spectroscopy and Microscopy Alexander Gray University of California, Davis Materials Sciences Division, Lawrence Berkeley National Laboratory with C. Papp1,2,14, B. Balke1,2,13, S. Ueda3, K. Kobayashi3,4, F. Kronast5, M. Gorgoi5, R. Ovsyannikov5, F. Schaefers5, S.-H. Yang6, L. Plucinski7, S. Döring8, U. Berges8, M. Huijben9,10, D. Buergler7, E. Rotenberg11, A. Bostwick11, B.C. Sell1,2,12, M. W. West2, M. Press2, F. Salmassi2,J.B. Kortright2, E. Gullikson2, S.S.P. Parkin6, W. Braun5, H. Dürr5, W. Eberhardt5, C. Westphal8, C.M. Schneider7, R. Ramesh2,9, C. Felser14 and C.S. Fadley1,2 1Physics, UC Davis; 2Mat. Sci. Div., LBNL; 3SPring8; 4NIMS; 5HZB-BESSY Berlin; 6IBM Almaden; 7Research Center Jűlich; 8Physics, Tech. Univ. Dortmund; Physics; 9Mat. Sci., UC Berkeley; 10Univ. of Twente; 11ALS, LBNL;12 Pres. Add.--Physics, Otterbein Coll.; 13 Pres. Add.--Univ. Mainz, 14 Pres. Add.--Univ. Erlangen Funded by the U.S. Department of Energy, under Contract No. DEAC02-05CH11231 and the Humboldt Foundation Materials Science Division. Fadley Group.
Presentation Outline • Basic methodology • The La0.67Sr0.33MnO3/SrTiO3 Interface • Measurement Method • Measurement Results • Analysis • The MgO/Fe MTJ Interface on Multilayer Mirror • Measurement Method • Measurement Results • Analysis • Co Microdot Arrays on Multilayer Mirror • Measurement Method • Measurement Results • Analysis • Summary 8/20/2014 Materials Science Division. Fadley Group. 2
Measurement Technique Standing-Wave Excited Photoemission % modulation 100 x 4R: E.g. R = 5% 90% modulation R = 1% 40% modulation 8/20/2014 Materials Science Division. Fadley Group. 3
La0.67Sr0.33MnO3/SrTiO3 Interface La3d5/2 Resonance Peak and Reflectivity Measurements 8/20/2014 Materials Science Division. Fadley Group. 4
La0.67Sr0.33MnO3/SrTiO3 Interface Rocking Curve Measurements and Simulations Grazing Angle (Degrees) Grazing Angle (Degrees) hν = 833.2 eV hν = 5956.4 eV Exp. Cal. 8/20/2014 Materials Science Division. Fadley Group. 5
La0.67Sr0.33MnO3/SrTiO3 Interface Analysis Results 8/20/2014 Materials Science Division. Fadley Group. 6
La0.67Sr0.33MnO3/SrTiO3 Interface Decreasing Thickness Profile Bragg Kiessig Exp. Cal. hv = 833.2 eV hv = 5956.4 eV Sr3p 3/2 Sr3p 3/2 Thickness Gradient Profile Ti2p 3/2 Ti2p 3/2 LSMO STO Substrate Vacuum BEST FIT
La0.67Sr0.33MnO3/SrTiO3 Interface Constant Linear Thickness Profile Exp. Cal. hv = 833.2 eV hv = 5956.4 eV Sr3p 3/2 Sr3p 3/2 Thickness Gradient Profile Ti2p 3/2 Ti2p 3/2 LSMO STO Substrate Vacuum • Amplitude of the Kiessig fringes does not agree with the experiment • Suppressed Kiessig fringes appear on both sides of the rocking curves
La0.67Sr0.33MnO3/SrTiO3 Interface Increasing Thickness Profile Exp. Cal. hv = 833.2 eV hv = 5956.4 eV Sr3p 3/2 Sr3p 3/2 Thickness Gradient Profile Ti2p 3/2 Ti2p 3/2 LSMO STO Substrate Vacuum Kiessig fringes appear on the wrong side of the rocking curves
La0.67Sr0.33MnO3/SrTiO3 Interface Decreasing Thickness Profile Exp. Cal. hv = 833.2 eV hv = 5956.4 eV Sr3p 3/2 Sr3p 3/2 Thickness Gradient Profile Ti2p 3/2 Ti2p 3/2 LSMO STO Substrate Vacuum BEST FIT
La0.67Sr0.33MnO3/SrTiO3 Interface Analysis Results LSMO STO 8/20/2014 Materials Science Division. Fadley Group. 11
La0.67Sr0.33MnO3/SrTiO3 Interface Mn3p Chemical Shift at the Interface 8/20/2014 Materials Science Division. Fadley Group. 12
La0.67Sr0.33MnO3/SrTiO3 Interface Mn3p Chemical Shift at the Interface Same interface effect is observed in a thicker multilayer (120 bilayers) 8/20/2014 Materials Science Division. Fadley Group. 13
Presentation Outline • Basic methodology • The La0.67Sr0.33MnO3/SrTiO3 Interface • Measurement Method • Measurement Results • Analysis • The MgO/Fe MTJ Interface on Multilayer Mirror • Measurement Method • Measurement Results • Analysis • Co Microdot Arrays on Multilayer Mirror • Measurement Method • Measurement Results • Analysis • Summary 8/20/2014 Materials Science Division. Fadley Group. 14
Measurement Technique Standing-Wave Wedge Method Photo- Electron Or Soft X-ray 0.1 mm spot h = 0.5-6.0 keV Buried Interface Bragg Fixed phase MgO SW (|E2|) = x/2sininc dML Fe wedge MFe Scanned standing wave Si Mo Multilayer Mirror 1st order Bragg: x =2dMLsinBragg dML dML Si Mo SiO2 Scanned sample 6.0 mm Si-wafer With Yang, Parkin, Felser,… 8/20/2014 Materials Science Division. Fadley Group. 15
MgO/Fe Interface Wedge San Fits (b) (a) (d) Al 2p Mg 2p Fe 3p Expt. YXRO Calc. R-factor analysis of the concentration interface (f) (e) O 1s C 1s 8/20/2014 Materials Science Division. Fadley Group. 16
MgO/Fe Interface MCD with Standing-Wave Excitation (hv = 900 eV) [ILCP+IRCP]/2 Fe 2p3/2 ILCP IRCP Fe 2p1/2 Z Position IMCD = 2[ILCP-IRCP]/[ILCP+IRCP] IMCD Z Position 8/20/2014 Materials Science Division. Fadley Group. 17
MgO/Fe Interface MCD with Standing-Wave Excitation (hv = 900 eV) R-factor analysis of the magnetization interface Fe 2p MCD 8/20/2014 Materials Science Division. Fadley Group. 18
MgO/Fe Interface Analysis Results Real sample: Concentration Profile C/O ≈ 10 Å Ideal growth recipe: Al2O3 14 Å 2 Å diffusion MgO 9 Å 4 Å diffusion Fe wedge 0-200 Å Atom-specific magnetization profile MgO 9 Å » Winterf 4 Å » Wmagn 2.6 Å - Fe wedge 0 200 Å 8/20/2014 Materials Science Division. Fadley Group. 19
MgO/Fe Interface SWedge Measurement Results Self-consistent X-ray optical modeling of core and valence PS 8/20/2014 Materials Science Division. Fadley Group. 20
Presentation Outline • Basic methodology • The La0.67Sr0.33MnO3/SrTiO3 Interface • Measurement Method • Measurement Results • Analysis • The MgO/Fe MTJ Interface on Multilayer Mirror • Measurement Method • Measurement Results • Analysis • Co Microdot Arrays on Multilayer Mirror • Measurement Method • Measurement Results • Analysis • Summary 8/20/2014 Materials Science Division. Fadley Group. 21
Cobalt Microdot Photoelectron Microscopy Experimental Setup and Measured Sample 8/20/2014 Materials Science Division. Fadley Group. 22
Cobalt Microdot Photoelectron Microscopy Photon Energy Rocking Curve Measurement Results: Al2p 8/20/2014 Materials Science Division. Fadley Group. 23
Cobalt Microdot Photoelectron Microscopy Photon Energy Rocking Curve Measurement Results: C1s 8/20/2014 Materials Science Division. Fadley Group. 24
Cobalt Microdot Photoelectron Microscopy Photon Energy Rocking Curve Measurement Results: Si2p 8/20/2014 Materials Science Division. Fadley Group. 25
Cobalt Microdot Photoelectron Microscopy Photon Energy Rocking Curve Measurement Results: Co3p 8/20/2014 Materials Science Division. Fadley Group. 26
Cobalt Microdot Photoelectron Microscopy Photon Energy Rocking Curve Measurement Results 8/20/2014 Materials Science Division. Fadley Group. 27
Summary • Photoelectron excitation with standing waves generated by reflection from multilayer mirror samples or substrates • Concentration profiles for constituent layers • Interface concentration profiles/average roughness • Element-specific magnetization profiles from MCD (MgO/Fe) • Complementary information from SX resonant and hard x-ray data, Bragg and Kiessig effects • Interface-specific core-level shifts (Mn in STO/LSMO) • Depth-resolved densities of states (MgO/Fe; STO/LSMO) • Depth-resolved photoelectron microscopy (Co microdots) 8/20/2014 Materials Science Division. Fadley Group. 28
Supporting Slides 8/20/2014 Materials Science Division. Fadley Group. 29
La0.67Sr0.33MnO3/SrTiO3 Interface Mn3p Chemical Shift at the Interface The interface chemical shift in Mn is observed in surface-sensitive soft x-ray data, but not in the bulk-sensitive hard x-ray data. 8/20/2014 Materials Science Division. Fadley Group. 30
Expt’l. bandgap 3.3 eV = 0.24 Ry STO and LSMO band structures Empirical alignment of EF allows first 2-3 eV of LSMO bands to be seen (Kumigashira et al., J.A.P. 99, 08S903 (2006)) Zheng, Binggeli, J. Phys. Cond. Matt. 21, 115602 (2009) Chikamatsu et al., PRB 73, 195105 (2006) Mn eg eg Mn t2g t2g Mattheiss, PRB 6, 4718 (1972)
La0.67Sr0.33MnO3/SrTiO3 Interface Valence Band Rocking Curve Measurements The Mn eg and t2g peaks “rock” in-phase with the 3p peak 8/20/2014 Materials Science Division. Fadley Group. 32
La0.67Sr0.33MnO3/SrTiO3 Interface ARPES 8/20/2014 Materials Science Division. Fadley Group. 33
Cobalt Microdot Photoelectron Microscopy XMCD Microscopy 8/20/2014 Materials Science Division. Fadley Group. 34