Download
1 / 48
480 likes | 484 Views
Image courtesy of NASA/GSFC. Global Climate Change: How We Got Here, and What Do We Do Now?. Eugene S. Takle Professor of Atmospheric Science Department of Geological and Atmospheric Sciences Professor of Agricultural Meteorology Department of Agronomy Interim Faculty Director

E N D
Global Climate Change: How We Got Here, and What Do We Do Now? Eugene S. Takle Professor of Atmospheric Science Department of Geological and Atmospheric Sciences Professor of Agricultural Meteorology Department of Agronomy Interim Faculty Director University Honors Program Director Climate Science Initiative Iowa State University Ames, Iowa 50011 gstakle@iastate.edu Golden K Kiwanis Club Ames, IA 17 April 2008
Outline • Scientific basis for climate change • Climate change and the scientific process • Moving beyond the science to take action • What do we do now? • Mitigation • Adaptation • Summary
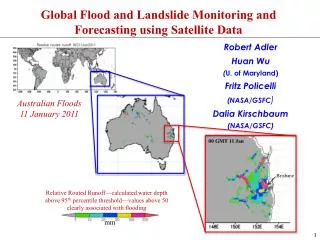
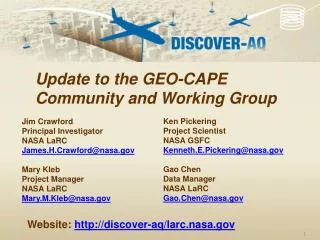
CO2, CH4 and temperature records from Antarctic ice core data Source:Vimeux, F., K.M. Cuffey, and Jouzel, J., 2002, "New insights into Southern Hemisphere temperature changes from Vostok ice cores using deuterium excess correction", Earth and Planetary Science Letters, 203, 829-843.
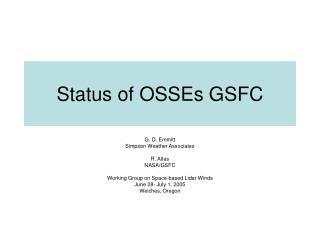
CO2, CH4 and temperature records from Antarctic ice core data Source:Vimeux, F., K.M. Cuffey, and Jouzel, J., 2002, "New insights into Southern Hemisphere temperature changes from Vostok ice cores using deuterium excess correction", Earth and Planetary Science Letters, 203, 829-843. Pattern repeats about every 100,000 years Natural cycles
Carbon Dioxide and Temperature “Business as Usual” 950 ppm (2100)
http://www.ncdc.noaa.gov/img/climate/research/2006/ann/glob_jan-dec-error-bar_pg.gifhttp://www.ncdc.noaa.gov/img/climate/research/2006/ann/glob_jan-dec-error-bar_pg.gif
Source: IPCC, 2001: Climate Change 2001: The Scientific Basis
Source: IPCC, 2001: Climate Change 2001: The Scientific Basis
El Chichon (1982) Agung, 1963 Mt. Pinatubo (1991) At present trends the imbalance = 1 Watt/m2 in 2018 Hansen, Scientific American, March 2004
http://www.ncdc.noaa.gov/img/climate/research/2006/ann/glob_jan-dec-error-bar_pg.gifhttp://www.ncdc.noaa.gov/img/climate/research/2006/ann/glob_jan-dec-error-bar_pg.gif
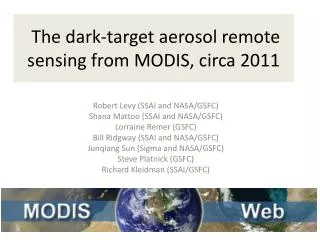
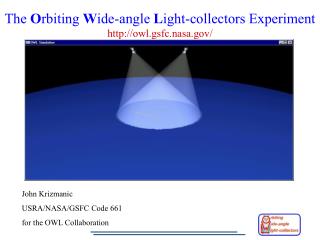
Natural and anthropogenic contributions to global temperature change (Meehl et al., 2004). Observed values from Jones and Moberg 2001. Grey bands indicate 68% and 95% range derived from multiple simulations.
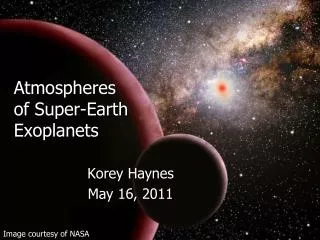
Natural and anthropogenic contributions to global temperature change (Meehl et al., 2004). Observed values from Jones and Moberg 2001. Grey bands indicate 68% and 95% range derived from multiple simulations. Natural cycles
Natural and anthropogenic contributions to global temperature change (Meehl et al., 2004). Observed values from Jones and Moberg 2001. Grey bands indicate 68% and 95% range derived from multiple simulations. Not Natural
Source: Jerry Meehl, National Center for Atmospheric Research
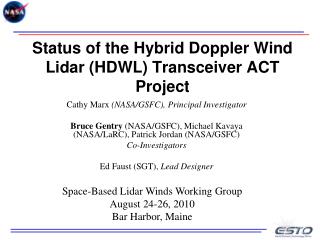
Energy intensive Reduced Consumption Energy conserving IPCC Fourth Assessment Report Summary for Policy Makers
Energy intensive Reduced Consumption Energy conserving The planet is committed to a warming over the next 50 years regardless of political decisions IPCC Fourth Assessment Report Summary for Policy Makers
Energy intensive Reduced Consumption Energy conserving The planet is committed to a warming over the next 50 years regardless of political decisions IPCC Fourth Assessment Report Summary for Policy Makers
Energy intensive Reduced Consumption Energy conserving The planet is committed to a warming over the next 50 years regardless of political decisions IPCC Fourth Assessment Report Summary for Policy Makers
Energy intensive Reduced Consumption Energy conserving Mitigation Possible Adaptation Necessary IPCC Fourth Assessment Report Summary for Policy Makers
Projected Changes for the Climate of Iowa/Midwest (My tentative assessment) • Longer frost-free period (high) • Higher average winter temperatures (high) • Fewer extreme cold temperatures in winter (high) • More extreme high temperatures in summer (medium) • Higher nighttime temperatures both summer and winter (high) • More (~10%) precipitation (medium) • More variability of summer precipitation (high) • More intense rain events and hence more runoff (high) • Higher episodic streamflow (medium) • Longer periods without rain (medium) • Higher absolute humidity (high) • Stronger storm systems (medium) • Reduced annual mean wind speeds (medium) Follows trend of last 25 years and projected by modelsNo current trend but model suggestion or current trend but models inconclusive
What To Do Now • Mitigation • Become active politically • National level - examine candidate platforms • Demand that state and local organizations examine carbon emissions • Examine personal choices • Home energy use • Auto type and use • Purchase of “stuff”
What To Do Now • Mitigation • Become active politically • National level - examine candidate platforms • Demand that state and local organizations examine carbon emissions • Examine personal choices • Home energy use • Auto type and use • Purchase of “stuff” • Adaptation • Stay informed of the best science on climate change for the Midwest • Encourage public and private investment in sustainable and resilient practices and infrastructure
What To Do Now:What are your public universities doing? • North American Regional Climate Change Assessment Program • ISU Climate Science Initiative/Institute • Midwest Consortium for Climate Assessment (MiCCA)
What To Do Now:What are your public universities doing? • North American Regional Climate Change Assessment Program • ISU Climate Science Initiative • Midwest Consortium for Climate Assessment (MiCCA)
North America Regional Climate Change Assessment Program: Participants Lead agency: NSF, with contributions from NOAA and DOE R. Arritt, D. Flory, W. Gutowski, E. Takle, Iowa State University, USA R. Jones, E. Buonomo, W. Moufouma-Okia, Hadley Centre, UK D. Caya, S. Biner, OURANOS, Canada D. Bader, P. Duffy, Lawrence Livermore National Laboratories, USA F. Giorgi, ICTP, Italy I. Held, NOAA Geophysical Fluid Dynamics Laboratory, USA R. Leung, Y. Qian, Pacific Northwest National Laboratories, USA L. Mearns, D. Middleton, D. Nychka, S. McInnes, NCAR, USA A. Nunes, John Roads, Scripps Institution of Oceanography, USA S. Sain, Univ. of Colorado at Denver, USA L. Sloan, M. Snyder, Univ. of California at Santa Cruz, USA
What To Do Now:What are your public universities doing? • North American Regional Climate Change Assessment Program • ISU Climate Science Initiative • Midwest Consortium for Climate Assessment (MiCCA) (proposed to NOAA)
ISU Climate Science Initiative • Launched by Vice President Brighton • Colleges of Agric, Engr, LAS have taken leadership, but broad campus research participation will be emphasized • Build on research strengths in regional climate modeling, agriculture, water, landscapes, engineering
Crop & horticulture production Soil erosion Conservation practices Water supplies Streamflow Water quality Beef and pork daily gains Livestock breeding success Milk and egg production Crop and livestock pests and pathogens Agricultural tile drainage systems Natural ecosystem species distributions Human health Building designs Recreation opportunities River navigation Roads and bridges How Will New Trends and Variability of Regional Climate Change Affect Who will provide authoritative information? How will it be delivered?
What To Do Now:What are your public universities doing? • North American Regional Climate Change Assessment Program • ISU Climate Science Initiative • Midwest Consortium for Climate Assessment (MiCCA)
Midwest Consortium for Climate Assessment (MiCCA) • Create seasonal climate forecasts for the Midwest • Use ensembles of advanced regional climate models interactive web-based decision-making tools, • Translate and enhance the latest NOAA climate forecast products to maximize economic gains • Use high-volume customized delivery and feedback through the county level extension service network
Summary • Climate change of the past 35 years is not consistent with natural variations over the last 400,000 years • Evidence clearly shows that radiative forcing due to anthropogenic greenhouse gases has contributed over half of the warming of the last 35 years • Mitigation efforts, although urgently needed, will have little effect on global warming until the latter half of the 21st century • Adaptation strategies should be developed for the next 50 years • Iowa State University will build on its strengths and provide authoritative information on climate change and climate variability for decision-makers