Download
1 / 48
480 likes | 630 Views
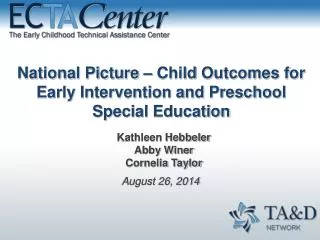
The National Picture on Child Outcomes for Early Intervention and Preschool Special Education. Kathy Hebbeler, ECO at SRI Lynne Kahn, NECTAC and ECO at FPG Division for Early Childhood October 30, 2012. Overview. National numbers and the quality of the state data

E N D
The National Picture on Child Outcomes for Early Intervention and Preschool Special Education Kathy Hebbeler, ECO at SRI Lynne Kahn, NECTAC and ECO at FPG Division for Early Childhood October 30, 2012
Overview • National numbers and the quality of the state data • The findings for FY 2010-11 • Findings over the last 3 years • State variation and data quality Early Childhood Outcomes Center
OSEP Reporting Requirements: Child Outcomes • Positive social emotional skills (including positive social relationships) • Acquisition and use of knowledge and skills (including early language/ communication [and early literacy]) • Use of appropriate behaviors to meet their needs Early Childhood Outcomes Center
If you have not seen the two-pager…. www.the-eco-center.org Early Childhood Outcomes Center
State Approaches to Outcomes Data, 2010-11 *Child Outcomes Summary Rating
Child Outcomes: What we know • States are in various stages with regard to building their child outcomes measurement systems • Some phrased in • Some changed approaches Early Childhood Outcomes Center
3 Methods Methods for Calculating National Estimates • States with the highest quality data weighted by child count to represent all states* • All states weighted by child count • All states averaged (each state weighted as 1) *The data we will be presenting for the national picture Early Childhood Outcomes Center
Identifying the States with Highly Questionable Data Criteria for eliminating states: • Not reporting data on enough children • Odd patterns in the data • Review of method reported suggested the data were of questionable quality Early Childhood Outcomes Center
Continued increase in the number of states included Number of States that Met Criteria for Inclusion in the National Analysis Early Childhood Outcomes Center
OSEP Reporting Categories Percentage of children who: a. Did not improve functioning b. Improved functioning, but not sufficient to move nearer to functioning comparable to same-aged peers c. Improved functioning to a level nearer to same-aged peers but did not reach it d. Improved functioning to reach a level comparable to same-aged peers e. Maintained functioning at a level comparable to same-aged peers 3 outcomes x 5 “measures” = 15 numbers Early Childhood Outcomes Center
And nowthe data…. And now the data…. Early Childhood Outcomes Center
The Summary Statements • Of those children who entered the program below age expectations in each outcome, the percent who substantially increased their rate of growth by the time they turned 3 [6] years of age or exited the program. • The percent of children who were functioning within age expectations in each outcome by the time they turned 3 [6] years of age or exited the program. Early Childhood Outcomes Center
Part C: Trends over Time Early Childhood Outcomes Center
Part C: Trends over Time Early Childhood Outcomes Center
Part B Preschool: Trends over Time Early Childhood Outcomes Center
Part B Preschool: Trends over Time Early Childhood Outcomes Center
Looking for Patterns Early Childhood Outcomes Center
Part B Preschool: States continue to report on more children Early Childhood Outcomes Center
% Early Childhood Outcomes Center
Maximum 75th Percentile 50th Percentile 25th Percentile Minimum Outlier
Variation across states in greater than expected growth (Summary Statement 1) : Part B 619 2010-11
Variation across states in exits at age expectations (Summary Statement 2) : Part B 619 2010-11
Variation across states in greater than expected growth (Summary Statement 1): Part C 2010-11
Variation across states in greater than expected growth (Summary Statement 2): Part C 2010-11
Conclusions • The data show good outcomes for many children who attend Part C and Part B, Preschool. • The data quality continues to get better. • The data will be a powerful tool for program improvement when • The data are consistently good at the local level • States and local programs consistently use it. Early Childhood Outcomes Center
For more information…. www.the-eco-center.org Early Childhood Outcomes Center