Download
1 / 25
250 likes | 357 Views
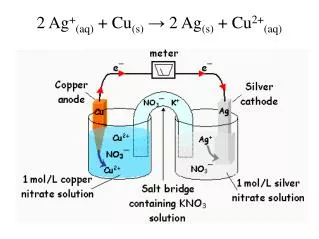
Sampling distribution of. s 2. The chi-square distribution results when independent variables with standard normal distributions are squared and summed. . Sampling distribution of. c 2.

E N D
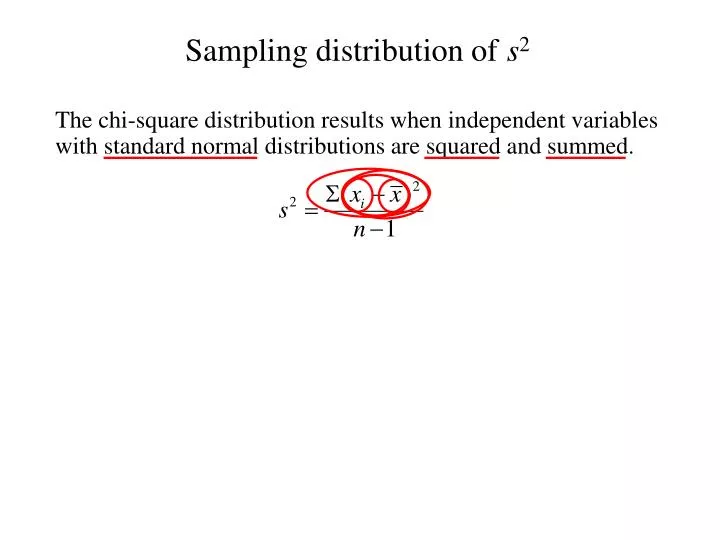
Sampling distribution of s2 The chi-square distribution results when independent variables with standard normal distributions are squared and summed.
Sampling distribution of c2 The chi-square distribution results when independent variables with standard normal distributions are squared and summed. n – 1 0
Sampling distribution of c2 The chi-square distribution results when independent variables with standard normal distributions are squared and summed. .025
Sampling distribution of c2 The chi-square distribution results when independent variables with standard normal distributions are squared and summed. .975
Interval Estimation of s 2 first substitute(n- 1)s2/ 2 for c2 into the following inequality To derive the interval estimate of 2, Now write the above as two inequalities
Interval Estimation of s 2 Next, multiply the inequalities by 2 Divide both of the inequalities above by the respective chi-square critical value:
Interval Estimation of s 2 The 95% confidence interval for the population variance
Interval Estimation of s 2 The 1 - aconfidence interval for the population variance a/2 1 - a/2
Interval Estimation of s 2 Example 1 Buyer’s Digest rates thermostats manufactured for home temperature control. In a recent test, ten thermostats manufactured by ThermoRite were selected at random and placed in a test room that was maintained at a temperature of 68oF. Use the ten readings in the table below to develop a 95% confidence interval estimate of the population variance. Thermostat1 2 3 4 5 6 7 8 9 10 Temperature 67.4 67.8 68.2 69.3 69.5 67.0 68.1 68.6 67.9 67.2
Interval Estimation of s 2 -0.7 -0.3 0.1 1.2 1.4 -1.1 0.0 0.5 -0.2 -0.9 67.4 67.8 68.2 69.3 69.5 67.0 68.1 68.6 67.9 67.2 0.49 0.09 0.01 1.44 1.96 1.21 0.00 0.25 0.04 0.81 sum = 6.3 s 2 = 0.7
Interval Estimation of s 2 (10 -1)(0.7) (10 -1)(0.7)
Interval Estimation of s 2 (10 -1)(0.7) (10 -1)(0.7) 0.25 0.975 1-a = .95 .025 .025 2 0 9
Interval Estimation of s 2 (10 -1)(0.7) (10 -1)(0.7) 0.25 0.975 We are 95% confident that the populationvariance is in this interval
Hypothesis Testing – One Variance Example 2 Recall that Buyer’s Digest is rating ThermoRite thermostats. Buyer’s Digest gives an “acceptable” rating to a thermostat with a temperature variance of 0.5 or less. Conduct a hypothesis test--at the 10% significance level--to determine whether the ThermoRite thermostat’s temperature variance is “acceptable”. Hypotheses: Recall that s2 = 0.7 and df = 9. With = 0.5,
Our value Hypothesis Testing – One Variance a= .10 (column) and df = 10 – 1 = 9 (row)
Hypothesis Testing – One Variance = .10 Do not reject H0 Reject H0 .10 9 There is insufficient evidence to conclude that the temperature variance for ThermoRite thermostats is unacceptable.
Sampling distribution of F The F-distribution results from taking the ratio of variances of normally distributed variables. if s12 = s22
Sampling distribution of F The F-distribution results from taking the ratio of variances of normally distributed variables. Bigger if s12 = s22 ≈1 0 1
Sampling distribution of F The F-distribution results from taking the ratio of variances of normally distributed variables. ≈1 .025
Sampling distribution of F The F-distribution results from taking the ratio of variances of normally distributed variables. ≈1 .975
Hypothesis Testing – Two Variances Example3 Buyer’s Digest has conducted the same test, but on 10 other thermostats. This time it test thermostats manufactured by TempKing. The temperature readings of the 10 thermostats are listed below. We will conduct a hypothesis at a 10% level of significance to see if the variances are equal for both thermostats. ThermoRite Sample Temperature 67.4 67.8 68.2 69.3 69.5 67.0 68.1 68.6 67.9 67.2 s2 = 0.7 and df = 9 TempKing Sample Temperature 67.7 66.4 69.2 70.1 69.5 69.7 68.1 66.6 67.3 67.5 s2 = ? and df = 9
Hypothesis Testing – Two Variances TempKing -0.51 -1.81 0.99 1.89 1.29 1.49 -0.11 -1.61 -0.91 -0.71 67.7 66.4 69.2 70.1 69.5 69.7 68.1 66.6 67.3 67.5 0.2601 3.2761 0.9801 3.5721 1.6641 2.2201 0.0121 2.5921 0.8281 0.5041 sum = 15.909 Since this is larger Than ThermoRite’s s 2 = 1.768
Hypothesis Testing – Two Variances Hypotheses: n1 = 10 – 1 = 9 (column) & n2 - 1 = 9 a/2= .05 (row)
Hypothesis Testing – Two Variances There is insufficient evidence to conclude that the population variances differ for the two thermostat brands. Reject H0 Do not Reject H0 Reject H0 .05 .05 ≈ 1


![CP = E[ s 2 , s 5 , s 1 , s 3 , s 2 ’ , s 3 ’ , s 4 , s 1 ’ , s 4 ’ , s 5 ’ ] S[] I[]](https://cdn3.slideserve.com/6546826/slide1-dt.jpg)