Download
1 / 45
630 likes | 1.25k Views
The Ocular Hypertension Treatment Study (OHTS). Supported by the National Eye Institute, National Center on Minority Health and Health Disparities, Research to Prevent Blindness, and Merck Research Laboratories. Ocular Hypertension.

E N D
The Ocular HypertensionTreatment Study (OHTS) Supported by the National Eye Institute, National Center on Minority Health and Health Disparities, Research to Prevent Blindness, and Merck Research Laboratories
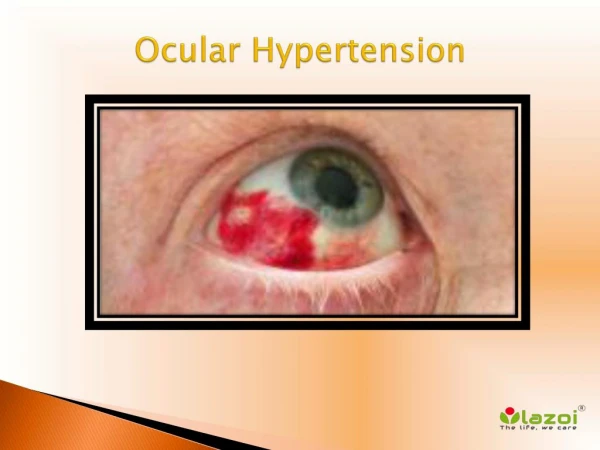
Ocular Hypertension • Elevated IOP in the absence of clinicallydetectable optic nerve or visual field changes • A common finding • What to do? • Treat all? • Treat no one? • Treat some? Then who?
Why did we do this study? Don’t we know that treatment prevents open angle glaucoma?
Does Treatment of Ocular Hypertension prevent POAG? Limitations of previous studies: • Varying endpoints • Limited treatment regimens • Small sample size
Ocular Hypertension Treatment Study (OHTS)Primary Goals • Evaluate the safety and efficacy of topical ocular hypotensive medication in delaying or preventing the development of POAG in individuals with elevated IOP • Identify baseline demographic andclinical factors that predict whichparticipants will develop POAG
Age 40 - 80 Normal visual fields Humphrey 30-2 Normal optic discs Untreated IOP: 24 to 32 mmHg in qualifying eye 21 to 32 mmHg in fellow eye The OHTS Entry Criteria
Patient found eligible for OHTS • Eligible untreated IOPs on 2 visits • 2 sets of normal & reliable HVFs per VFRC • Optic discs judged normal by ODRC Randomization Medication Topical treatment to lower IOP 20% and IOP < 24 mm Hg Observation No topical treatment to lower IOP Adjust therapy if target not met Monitoring Humphrey 30-2 q6 months Stereoscopic disc photos annually Reproducible Abnormality 3 consecutive visual fields and/or 2 consecutive sets of optic disc photographs as determined by masked readers at ODRC or VFRC POAG Visual field and/or optic disc changes attributed to POAG by masked Endpoint Committee
Baseline Characteristics by Randomization GroupGender & Age Ages
Baseline Characteristics by Randomization GroupSelf-designated Race
Baseline Characteristics by Randomization GroupOphthalmic Measurements * Overall n=1398 for central corneal thickness, n=699 (86%) per randomization group. Measurements were conducted after 1999, about 2 years after the last participant was randomized.
Baseline Characteristics by Randomization GroupVisual Field Indices
Baseline Characteristics by Randomization GroupPossible Risk Factors
Baseline Characteristics by Randomization GroupMedical History
Box Plot of IOP by Randomization GroupMedian IOP is joined by a line. Box: 25% and 75% Whiskers: 10% and 90% Medication Observation IOP (mm Hg) Months
Percent of Medication Patients on Different MedicationsPatients may be on more than one medication 0 12 24 36 48 60 Months 72 84
Progress and Outcome of Study Participants Log rank p<0.001
Primary POAG Endpoints*Log Rank P-value <0.001, Hazard Ratio 0.40, 95% CI (0.27, 0.59) Observation Medication Proportion POAG *through 8 Nov 2001 Months
1st Visual Field POAG Endpoint*Log Rank P-value=0.002, Hazard Ratio=0.45, 95% CI (0.26, 0.76) Observation Medication Proportion POAG *through 8 Nov 2001 Months
1st Optic Disc POAG Endpoint*Log Rank P-value<0.001, Hazard Ratio 0.36, 95% CI (0.23, 0.56) Observation Medication Proportion POAG *through 8 Nov 2001 Months
All cause reproducible abnormalitiesin visual fields and/or optic discs were significantly reduced in medication group. Hazard ratio 0.58, 95% CI (0.44-0.76) P=0.00008
African Americans 12.7% POAG endpoints in observation group 6.9% POAG endpoints in medication group Hazard Ratio 0.54 P value for interaction 0.26 Others 10.2% POAG endpoints in observation group 3.6% POAG endpoints in medication group Hazard Ratio 0.34 Treatment perhaps less protectivein African Americans
No Significant Safety Difference Between Randomization Groups • Mortality • Hospitalizations • New Medical Conditions • Worsening of Pre-existing Conditions • SF – 36/any subscale • Patient Reported Ocular and Systemic Symptoms
No difference between randomization groups in serious AEs for 9 of 11 organ systems.
Borderline Safety Differences Between Randomization Groups • Cataract surgery • Serious psychiatric adverse events • Serious genitourinary adverse events
Summary • Treatment produced about a 20% reduction in IOP. • Treatment reduced incidence of POAG in OHT participants by more than 50% at 5 years from 9.5% in the Observation Group to 4.4 % in the Medication Group. • Little evidence of safety concerns.
Significant Baseline Predictive Factorsfrom Univariate Proportional Hazards Models Hazard Ratio (95% CI) 1.43 (1.19, 1.71) Age Decade 1.59 (1.09, 2.32) African American origin 1.87 (1.31, 2.67) Male gender 0.40 (0.18, 0.92) Diabetes Mellitus 2.11 (1.23, 3.62) Heart Disease 1.11 (1.04, 1.18) IOP per mm Hg 1.88 (1.55, 2.29) CCT per 40 microns decrease 1.36 (1.16, 1.60) PSD per 0.2 dB increase Horizontal C/D Ratio per 0.1 increase 1.25 (1.14, 1.38) 1.32 (1.19, 1.46) Vertical C/D Ratio per 0.1 increase 0 1 2 3 4 5
Non Significant Baseline Predictive Factors from Univariate Proportional Hazards Models HazardRatio (95% CI) 1.10 (0.7, 1.59) Family History Glaucoma 0.70 (0.26, 1.89) Oral Beta Adrenergic Antagonists 1.35 (0.83, 2.19) Oral Calcium Channel Blocker 1.01 (0.58, 1.76) Migraine 1.31 (0.92, 1.87) High Blood Pressure 1.49 (0.73. 3.05) Low Blood Pressure 1.42 (0.35, 5.75) Stroke 1.16 (0.99, 1.35) CPSD per 0.3 dB 0.86 (0.73, 1.02) Mean Deviation (0.91 (0.62, 1.32) Myopia 0 4 5 1 2 3
Age (decade) Diabetes Mellitus IOP (per mmHg) CCT (per 40 µM decrease) PSD (per 0.2 dB increase) Horizontal C/D Ratio (per 0.1 increase) Vertical C/D Ratio (per 0.1 increase) 1.22 (1.01, 1.49) 0.37 (0.15, 0.90) 1.10 (1.04, 1.17) 1.71 (1.40, 2.09) 1.27 (1.06, 1.52) 1.27 (1.14, 1.40) 1.32 (1.19, 1.47) 0.0 1.0 2.0 3.0 4.0 5.0 Significant Baseline Predictive Factorsfrom Multivariate Proportional Hazard Models Hazard Ratio (95% CI)
African Americans have a higher prevalence and incidence of POAG. • OHTS data suggests that this racial effect may be due to thinner central corneas and larger cup/disc ratios.
POAG Endpoints by Central Corneal Thicknessand Baseline IOP (mmHg) in Observation Group* Baseline IOP (mmHg) >25.75 36% 13% 6% >23.75 to < 25.75 12% 10% 7% < 23.75 17% 9% 2% < 555 >555 to < 588 >588 Central Corneal Thickness (microns) * through 8 Nov 2001
POAG Endpoints by Central Corneal Thicknessand Baseline Vertical C/D Ratio in Observation Group* Vertical C/D Ratio >0.50 22% 16% 8% >0.30 to <0.50 26% 16% 4% < 0.30 15% 1% 4% < 555 >555 to < 588 >588 Central Corneal Thickness (microns) * through 8 Nov 2001
60-year-old WF • IOP 24 / 24 • C/D ratio 0.1 vertical • Corneal thickness 600 μ • Risk of POAG ~ 1% / 5 years
60-year-old WF • IOP 24 / 24 • C/D ratio 0.3 • Corneal thickness 540 μ • Risk of POAG ~ 7% / 5 years
60-year-old WF • IOP 28 / 28 • C/D ratio 0.1 • Corneal thickness 600 μ • Risk of POAG ~ 2% / 5 years
60-year-old WF • IOP 24 / 24 • C/D ratio 0.5 • Corneal thickness 490 μ • Risk of POAG ~ 20% / 5 years
72-year-old BM • IOP 25 / 25 • C/D ratio 0.6 • Corneal thickness 510 μ • Risk of POAG ~ 35% / 5 years
Large sample size Careful follow-up Masked assessment of endpoints Attribution of endpoints to cause by masked committee Inclusion of all commercially available drugs Careful quality control and feedback to technicians and photographers True-incidence cases Strengths
Convenience sample rather than population based Relatively small number of POAG endpoints Healthy volunteers Limited IOP range Limited to patients with reliable visual fields “Squeaky clean” participants at baseline High thresholds for endpoints Some risk factors under-represented Weaknesses
Summary • Not every patient with OHT should be treated • Offer treatment to OHT patient at moderate to high risk taking into consideration: • Age • Medical status • Life expectancy • Likely treatment benefit • Consider measuring corneal thickness in all patients with OHT or glaucoma.
Treat all patients with elevated IOP. Risk of POAG is low in this population. Glaucoma medications are harmless. Risk factors for developing POAG are clearly delineated; influence of race, gender, hypertension, heart disease, family history, blood pressure, and diabetes are all clear. 20% lowering of IOP is the correct target for OHT. Drug X is proven to prevent glaucoma in OHT. Possible Misinterpretations of OHTS
OHTS Resource Centers Study Chairman’s Office & Coordinating Center Washington University St. Louis, MO Optic Disc Reading Center Bascom Palmer Eye Institute University of Miami Miami, FL Visual Field Reading Center University of California, Davis Sacramento, CA
Bascom Palmer Eye Institute Eye Consultants of Atlanta Eye Physicians and Surgeons Cullen Eye Institute Devers Eye Institute Emory Eye Institute Henry Ford Hospitals Johns Hopkins University Krieger Eye Institute Howard University University of Maryland University of California, Los Angeles Charles Drew University Kellogg Eye Center Kresge Eye Institute Great Lakes Eye Institute University of Louisville Mayo Clinic New York Eye & Ear Infirmary Ohio State University Ophthalmic Surgeons & Consultants Pennsylvania College of Optometry MCP/Hahnemann University Scheie Eye Institute University of California, Davis University of California, San Diego University of California, San Francisco University Suburban Health Center University of Ophthalmic Consultants Washington Eye Physicians & Surgeons Eye Associates of Washington, DC Washington University, St. Louis OHTS Clinical Centers