Download
1 / 48
480 likes | 490 Views
ENGM 720 - Lecture 04. Comparison of Means, Confidence Intervals (CIs), & Operating Characteristic (OC) Curves. Assignment:. Reading: Chapter 4 Finish reading through 4.3.4 Begin reading 4.4 through 4.4.3 Chapter 8 Begin reading 8 through 8.3 Assignments:

E N D
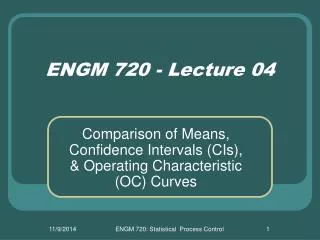
ENGM 720 - Lecture 04 Comparison of Means, Confidence Intervals (CIs), & Operating Characteristic (OC) Curves ENGM 720: Statistical Process Control
Assignment: • Reading: • Chapter 4 • Finish reading through 4.3.4 • Begin reading 4.4 through 4.4.3 • Chapter 8 • Begin reading 8 through 8.3 • Assignments: • Obtain the Hypothesis Test (Chart &) Tables – Materials Page • Obtain the Exam Tables DRAFT– Materials Page • Verify accuracy as you work assignments • Access New Assignment and Previous Assignment Solutions: • Download Assignment 2 Solutions • Download Assignment 3 Instructions ENGM 720: Statistical Process Control
Hypothesis Tests • An Hypothesis is a guess about a situation that can be tested, and the test outcome can be either true or false. • The Null Hypothesis has a symbol H0, and is always the default situation that must be proven unlikelybeyond a reasonable doubt. • The Alternative Hypothesis is denoted by the symbol HA and can be thought of as the opposite of the Null Hypothesis - it can also be either true or false, but it is always false when H0 is true and vice-versa. ENGM 720: Statistical Process Control
Hypothesis Testing Errors • Type I Errors occur when a test statistic leads us to reject the Null Hypothesis when the Null Hypothesis is true in reality. • The chance of making a Type I Error is estimated by the parameter (or level of significance), which quantifies the reasonable doubt. • Type II Errors occur when a test statistic leads us to fail to reject the Null Hypothesis when the Null Hypothesis is actually false in reality. • The probability of making a Type II Error is estimated by the parameter . ENGM 720: Statistical Process Control
2 2 θ0 θA θA -θ0 +θ0 θA θA θ0 Dm Dm Dm Types of Hypothesis Tests Hypothesis Tests & Rejection Criteria H0: MA is not different than M0 H0: MA is not better than M0 H0: MA is not better than M0 HA: MA is higher than M0 HA: MA is different than M0 HA: MA is lower than M0 One-Sided Test Statistic < Rejection Criterion H0: θA≥θ0 HA: θA< θ0 Two-Sided Test Statistic < -½ Rejection Criterion or Statistic > +½ Rejection Criterion H0: -θ0≤θA≤ +θ0 HA: θA< -θ0 or +θ0< θA One-Sided Test Statistic > Rejection Criterion H0: θA≤θ0 HA: θA>θ0 ENGM 720: Statistical Process Control
Hypothesis Testing Steps • State the null hypothesis (H0) from one of the alternatives: that the test statistic MA = M0 , MA≥ M0 , or MA≤ M0 . • Choose the alternative hypothesis (HA) from the alternatives: MA¹ M0 , MA< M0,or MA> M0 .(Respective to above!) • Choose a significance level of the test (a). • Select the appropriate test statistic and establish a critical region. (If the decision is to be based on a P-value, it is not necessary to have a critical region) • Compute the value of the test statistic () from the sample data. • Decision: Reject H0 if the test statistic has a value in the critical region (or if the computed P-value is less than or equal to the desired significance level a); otherwise, do not reject H0. ENGM 720: Statistical Process Control
Testing Example • Single Sample, Two-Sided t-Test: • H0: µ = µ0 versus HA: µ ¹ µ0 • Test Statistic: • Critical Region: reject H0 if |t| > t/2,n-1 • P-Value: 2 • P(X ³ |t|), where the random variable x has a t-distribution with n_1 degrees of freedom ENGM 720: Statistical Process Control
Hypothesis Testing H0: μ = μ0 versus HA: μμ0 tn-1 distribution P-value = P(X£-|t|) + P(X³|t|) 0 |t| -|t| ENGM 720: Statistical Process Control
True Situation H0 is True H0 is False H0 is True CORRECT Type II Error () Test Conclusion H0 is False Type I Error () CORRECT Hypothesis Testing • Significance Level of a Hypothesis Test:A hypothesis test with a significance level or size rejects the null hypothesis H0 if a p-value smaller than is obtained, and accepts the null hypothesis H0 if a p-value larger than is obtained. In this case, the probability of a Type I error (the probability of rejecting the null hypothesis when it is true) is equal to . ENGM 720: Statistical Process Control
Hypothesis Testing • P-Value:One way to think of the P-value for a particular H0 is: given the observed data set, what is the probability of obtaining this data set or worse when the null hypothesis is true. A “worse” data set is one which is less similar to the distribution for the null hypothesis. P-Value 1 0 0.10 0.01 H0not plausible Intermediate area H0plausible ENGM 720: Statistical Process Control
Statistics and Sampling • Objective of statistical inference: • Draw conclusions/make decisions about a population based on a sample selected from the population • Random sample – a sample, x1, x2, …, xn , selected so that observations are independently and identically distributed (iid). • Statistic – function of the sample data • Quantities computed from observations in sample and used to make statistical inferences • e.g. measures central tendency ENGM 720: Statistical Process Control
Sampling Distribution • Sampling Distribution – Probability distribution of a statistic • If we know the distribution of the population from which sample was taken, we can often determine the distribution of various statistics computed from a sample, ex: • When the CLT applies, the distribution is Normal • When sampling for defective units in a large population, use the Binomial distribution • When working with the sum of squared Normal distributions, use the 2-distribution ENGM 720: Statistical Process Control
e.g. Sampling Distribution of the Mean from the Normal Distribution • Take a random sample, x1, x2, …, xn, from a normal population with mean μ and standard deviation σ, i.e., • Compute the sample average x • Then x will be normally distributed with mean μ and standard deviation: that is: ENGM 720: Statistical Process Control
Ex. Sampling Distribution of x • When a process is operating properly, the mean density of a liquid is 10 with standard deviation 5. Five observations are taken and the average density is 15. • What is the distribution of the sample average? • r.v. x = density of liquidAns: since the samples come from a normal distribution, and are added together in the process of computing the mean: ENGM 720: Statistical Process Control
Ex. Sampling Distribution of x (cont'd) • What is the probability the sample average is greater than 15? • Would you conclude the process is operating properly? ENGM 720: Statistical Process Control
Ex. Sampling Distribution of x (cont'd) • What is the probability the sample average is greater than 15? • Would you conclude the process is operating properly? ENGM 720: Statistical Process Control
Definitely Different Probably Different Probably NOT Different Definitely NOT Different Comparison of Means • The first types of comparison are those that compare the location of two distributions. To do this: • Compare the difference in the mean values for the two distributions, and check to see if the magnitude of their difference is sufficiently large relative to the amount of variation in the distributions • Which type of test statistic we use depends on what is known about the process(es), and how efficient we can be with our collected data ENGM 720: Statistical Process Control
Situation I: Means Test, Both σ0 and μ0 Known • Used with: • an existing process with good deal of data showing the variation and location are stable • Procedure: • use the the z-statistic to compare sample mean with population mean 0 ENGM 720: Statistical Process Control
Situation II: Means Testσ(s) Known and μ(s) Unknown • Used when: • the means from two existing processes may differ, but the variation of the two processes is stable, so we can estimate the population variances pretty closely. • Procedure: • use the the z-statistic to compare both sample means ENGM 720: Statistical Process Control
Situation III: Means TestUnknown σ(s) and Knownμ0 • Used when: • have good control over the center of the distribution, but the variation changed from time to time • Procedure: • use the the t-statistic to compare both sample means v = n – 1 degrees of freedom ENGM 720: Statistical Process Control
Situation IV: Means Test Unknown σ(s) andμ(s), Similar s2 • Used when: • logical case for similar variances, but no real "history" with either process distribution (means & variances) • Procedure: • use the the t-statistic to compare using pooled S, v = n1 + n2 – 2 degrees of freedom ENGM 720: Statistical Process Control
Situation V: Means Test Unknown σ(s) and μ(s), Dissimilar s2 • Used when: • worst case data efficiency - no real "history" with either process distribution (means & variances) • Procedure: • use the the t-statistic to compare, degrees of freedom given by: ENGM 720: Statistical Process Control
Situation VI: Means Test Paired but Unknown σ(s) • Used when: • exact same sample work piece could be run through both processes, eliminating material variation • Procedure: • define variable (d) for the difference in test value pairs (di = x1i - x2i) observed on ith sample, v = n - 1 dof ENGM 720: Statistical Process Control
Table for Means Comparisons • Decision on which test to use is based on answering (at least some of) the following: • Do we know the population variance (σ2) or should we estimate it by the sample variance (s2)? • Do we know the theoretical mean (μ), or should we estimate it by the sample mean ( y) ? • Do we know if the samples have equal-variance (σ12 = σ22)? • Have we conducted a paired comparison? • What are we trying to decide (alternate hypothesis)? ENGM 720: Statistical Process Control
Table for Means Comparisons • These questions tell us: • What sampling distribution to use • What test statistic(s) to use • What criteria to use • How to construct the confidence interval • Six major test statistics for mean comparisons • Two sampling distributions • Six confidence intervals • Twelve alternate hypotheses ENGM 720: Statistical Process Control
Ex. Surface Roughness • Surface roughness is normally distributed with mean 125 and std dev of 5. The specification is 125 ± 11.65 and we have calculated that 98% of parts are within specs during usual production. This has been the case for a long time. • My supplier of these parts has sent me a large shipment. I take a random sample of 10 parts. The sample average roughness is 134 which is within specifications. • Test the hypothesis that the lot roughness is higher than specifications at = 0.05. ENGM 720: Statistical Process Control
e.g. Surface Roughness Cont'd • Check the hypothesis that the sample of size 10, and with an average of 134 comes from a population with mean 125 and standard deviation of 5. • One-Sided Test • H0: ≤0 • HA: > 0 • Test Statistic: = • Critical Value: • Z = 1.645 • Should I reject H0? • Yes! Since 5.69 > 1.645, it is likely that it exceeds the roughness. ENGM 720: Statistical Process Control
134 134 ex. cont'ddraw the distributions for the surface roughness and sample average ENGM 720: Statistical Process Control
e.g. Surface Roughness Cont'd • Find the probability that the sample of size 10, and with an average of 134 does not come from a population with mean 125 and standard deviation of 5. = • Should I accept this shipment? ENGM 720: Statistical Process Control
e.g. Surface Roughness Cont'd • For future shipments, suggest good cutoff values for the sample average • (i.e., accept shipment if average of 10 observations is between what and what)? • We know that encompasses over 99% of the probability mass of the distribution for x ENGM 720: Statistical Process Control
Operating Characteristic (OC) Curve • Relates the size of the test difference to Type II Error (b) for a given risk of Type I Error (a) • Designing a test involves a trade-off in sample size versus the power of the test to detect a difference • The greater the difference in means (d), the smaller the chance of Type II Error () for a given sample size and a. • As the sample size increases, the chance of Type II Error () decreases for a specified a and given difference in means (d). ENGM 720: Statistical Process Control
Operating Characteristic Curve ENGM 720: Statistical Process Control
O.C. Curve Use • Agree on acceptable a • Need to have an OC curve for the correct hypothesis test and the correct a-level • Estimate anticipated d and s to compute d: • d = | m1 - m2| = |d| ss • Look for where d intersects with desired b (Probability of accepting H0) to estimate the required sample size (n) ENGM 720: Statistical Process Control
OC Curve Example (uses Fig 3-7, p.111) • Assume our previous problem had a process std. dev. of 18 (instead of 5), and the same means (125 population & spec, 134 supplier sample). • Assume the boss wants = 0.05 of exceeding either the high or low spec. for such a sample. • Probability of what (in English)? • Contracting an incapable supplier, based on a bad-luck test outcome • Assume supplier needs = 0.2 • Probability of what (in English)? • Unfairly being the incapable supplier, based on a bad-luck test outcome • What sample size is needed to fit these constraints? ENGM 720: Statistical Process Control
n = 30 β = d = 0.5 Two-Sided Operating Characteristic Curve, = 0.05 ENGM 720: Statistical Process Control
Estimation of Process Parameters • In SPC: • the probability distribution is used to model a quality characteristic (e.g. dimension of a part, viscosity of a fluid) • Therefore: • we are interested in making inferences about the parameters of the probability distribution • (e.g. mean μand variance σ2) • Since: • Values of these parameters are generally not known, so we need to estimate them from sample data ENGM 720: Statistical Process Control
Point Estimate • Numerical value, computed from a sample of data, used to estimate a parameter of a distribution • Example: • Say we take n = 50 measurements of a quality characteristic • Sample mean is point estimate of μi.e. • Sample variance is point estimate of σ2i.e. ENGM 720: Statistical Process Control
Confidence Intervals • A confidence interval for an unknown parameter is an interval that contains a set of likely values of the parameter. It is associated with a confidence level 1- , which measures the probability that the confidence interval actually contains the unknown parameter. θ ENGM 720: Statistical Process Control
Confidence Interval (C.I.)(Interval Estimate) • A C.I. is an interval that, with some probability, includes the true value of the parameter • Ex. C.I. of mean μ is • L - lower confidence limit • U - upper confidence limit • (1-a) - probability that true value of parameter lies in interval (we pick a) • The interval LμU is called a 100(1-a)% C.I. for the mean ENGM 720: Statistical Process Control
C.I. on the Mean of Normal Distribution with Variance Unknown • Suppose , and • We don't know the true mean μ or true variance σ2 • A 100(1-a)% C.I. for the unknown (true) mean μ is: • - sample mean • s - sample standard deviation • n - number of observations in sample • - value of t distribution ENGM 720: Statistical Process Control
Ex. C.I. on the Mean of Normal Distribution with Variance Unknown • Automatic filler deposits liquid in a container. • WANT: 95% C.I. on the mean amount (ounces) per container • Collect random sample: x1, x2, …, xnsay n = 10 • Compute sample average: • Compute sample variance: ENGM 720: Statistical Process Control
Ex. C.I. on Mean cont'd • Find the t-distribution value: • Look in Table (Appendix IV) • Want a 95% C.I. so, 100(1 - a)% = 95% a = 0.05 = degrees of freedom = (n -1) = 9so … ENGM 720: Statistical Process Control
Ex. C.I. on Mean cont'd • Find the t-distribution value: • Look in Table (Appendix IV) • Want a 95% C.I. so, 100(1 - a)% = 95% a = 0.05 = degrees of freedom = (n -1) = 9so … • Substitute into C.I. - or - ENGM 720: Statistical Process Control
Interpretation of a 95% C.I. • Repeat sampling 10,000 (or many, many) times & obtain C.I.s • Each C.I. will have (slightly) different center point and width • On average, 95% of the C.I.s will include the true mean ENGM 720: Statistical Process Control
C.I.s on Other Parameters and Quantities • Same procedure, different formulas • For example, C.I. on • Mean (of any distribution) when variance is known • Variance of a normal distribution • Difference in two means (of any distribution) when variances are known • Difference in two means from normal distribution when variances are unknown • Ratio of variances of two normal distributions • etc. ... • (See textbook Sections 4.3.1, 4.3.4 to review derivations) ENGM 720: Statistical Process Control
Questions & Issues ENGM 720: Statistical Process Control