Download
1 / 1
10 likes | 155 Views
Extinction P. Thompson, B. Gilfus, J. Neeley, A. James, E. Moyer P. Enrique da Silva, A. Kanaan, S. Kanbur. 2 nd Order Catalog Extinction User input: night, filter, catalog (list of stars with known m 0 s) Extinction equation: m = m 0 + a + k(airmass) + k’(airmass)(color)

E N D
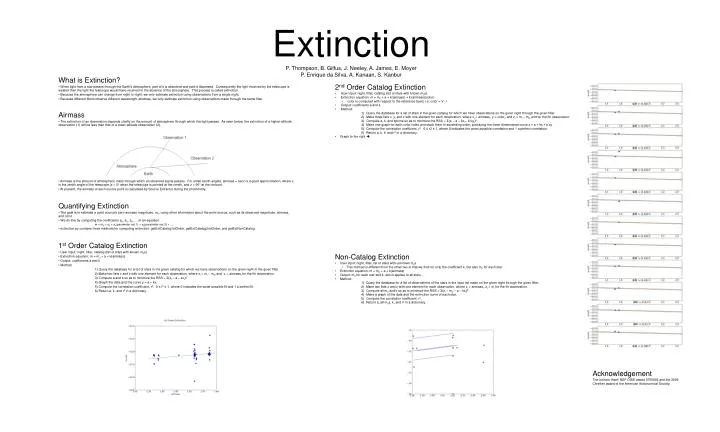
Extinction P. Thompson, B. Gilfus, J. Neeley, A. James, E. Moyer P. Enrique da Silva, A. Kanaan, S. Kanbur • 2nd Order Catalog Extinction • User input: night, filter, catalog (list of stars with known m0s) • Extinction equation: m = m0 + a + k(airmass) + k’(airmass)(color) • color is computed with respect to the reference band, i.e. color = V - I • Output: coefficients a and k • Method: • Query the database for a list of stars in the given catalog for which we have observations on the given night through the given filter. • Make three lists x, y, and z with one element for each observation, where xi = airmassi, y = colori, and zi = mi – m0i and for the ith observation. • Compute a, k, and kprime so as to minimize the RSS = Σ(zi – a – kxi – k’xiyi)2. • Make one graph for each color index and stack them in ascending order, portraying the three-dimensional curve z = a + kx + k’xy. • Compute the correlation coefficient, r2. 0 ≤ r2 ≤ 1, where 0 indicates the worst possible correlation and 1 a perfect correlation. • Return a, k, k’ and r2 in a dictionary. • Graph to the right • Non-Catalog Extinction • User input: night, filter, list of stars with unknown m0s • This method is different from the other two in that we find not only the coefficient k, but also m0 for each star. • Extinction equation: m = m0 + a + k(airmass) • Output: m0 for each star and k, which applies to all stars • Method: • 1) Query the database for a list of observations of the stars in the input list made on the given night through the given filter. • 2) Make two lists x and z with one element for each observation, where xi = airmassi, zi = mi for the ith observation. • Compute all m0 and k so as to minimize the RSS = Σ(zi – m0 – a – kxi)2. • Make a graph of the data and the extinction curve of each star. • Compute the correlation coefficient, r2. • Return a, all m0s, k, and r2 in a dictionary. What is Extinction? When light from a star passes through the Earth’s atmosphere, part of it is absorbed and part is dispersed. Consequently the light received by the telescope is weaker than the light the telescope would have received in the absence of the atmosphere. This process is called extinction. Because the atmosphere can change from night to night, we only estimate extinction using observations from a single night. Because different filters observe different wavelength windows, we only estimate extinction using observations made through the same filter. Airmass The extinction of an observation depends chiefly on the amount of atmosphere through which the light passes. As seen below, the extinction of a higher-altitude observation (1) will be less than that of a lower-altitude observation (2). Airmass is the amount of atmospheric mass through which an observed signal passes. For small zenith angles, airmass = secz is a good approximation, where z is the zenith angle of the telescope (z = 0° when the telescope is pointed at the zenith, and z = 90° at the horizon). At present, the airmass of each source point is calculated by Source Extractor during the photometry. Quantifying Extinction The goal is to estimate a point source’s zero-airmass magnitude, m0, using other information about the point source, such as its observed magnitude, airmass, and color. We do this by computing the coefficients a0, a1, a2, … in an equation: m = m0 + a0 + a1(parameter set 1) + a2(parameter set 2) + … extinction.py contains three methods for computing extinction: getExtCatalog1stOrder, getExtCatalog2ndOrder, and getExtNonCatalog. 1st Order Catalog Extinction User input: night, filter, catalog (list of stars with known m0s) Extinction equation: m = m0 + a + k(airmass) Output: coefficients a and k Method: 1) Query the database for a list of stars in the given catalog for which we have observations on the given night in the given filter. 2) Make two lists x and z with one element for each observation, where zi = mi – m0i and xi = airmassi for the ith observation. 3) Compute a and k so as to minimize the RSS = Σ(zi – a – kxi)2. 4) Graph the data and the curve y = a + kx. 5) Compute the correlation coefficient, r2. 0 ≤ r2 ≤ 1, where 0 indicates the worst possible fit and 1 a perfect fit. 6) Return a, k, and r2 in a dictionary. Acknowledgement The authors thank NSF OISE award 0755646 and the 2009 Chretien award of the American Astronomical Society.