Download
1 / 11
110 likes | 266 Views
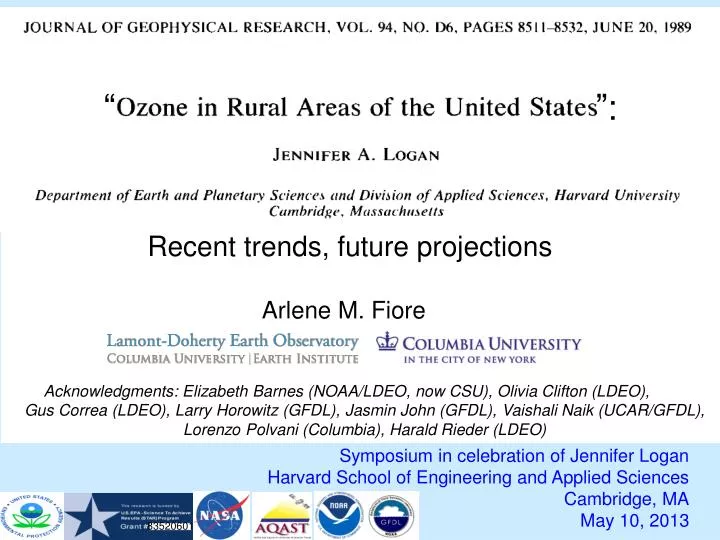
“ ”:. Recent trends, future projections. Arlene M. Fiore. Acknowledgments : Elizabeth Barnes (NOAA/LDEO , now CSU), Olivia Clifton (LDEO ), Gus Correa (LDEO ), Larry Horowitz (GFDL ), Jasmin John (GFDL), Vaishali Naik (UCAR/GFDL),

E N D
“ ”: Recent trends, future projections Arlene M. Fiore Acknowledgments: Elizabeth Barnes (NOAA/LDEO, now CSU), Olivia Clifton (LDEO), Gus Correa (LDEO), Larry Horowitz (GFDL), Jasmin John (GFDL), VaishaliNaik(UCAR/GFDL), Lorenzo Polvani (Columbia), HaraldRieder (LDEO) Symposium in celebration of Jennifer Logan Harvard School of Engineering and Applied Sciences Cambridge, MA May 10, 2013 83520601
Logan, 1989: expresses urgent need for routine measurements at rural sites in the Eastern USA April-Sept 1978-9 O3 cumulative probability distribution 0000-2300 LT (ppb) at SURE sites SURE and NAPBN sites Apr-Sep 1979 # days with O3 (8am-8pm) > 80 ppb 3-8% > 80 ppb Distribution not well described by Gaussian statistics, esp. upper tail Logan, 1989 Fig 3 (98% values: 80-103 ppb) • U.S. EPA CASTNet has now measured rural O3 for over two decades • How has the O3 distribution, including extreme events, changed? • What might the future hold?
Trends in seasonal daytime (11am-4pm) average ozone at rural U.S. monitoring sites (CASTNet): 1990 to 2010 SUMMER SPRING not significant significant 95% 95% 5% 5% Cooper et al., JGR, 2012 ppb yr-1 • Success in decreasing highest levels, but baseline rising (W. USA) • Decreases in EUS attributed in observations and models to NOx emission • controls in late 1990s, early 2000s [e.g., Frost et al., 2006; Hudman et al., 2007; van der A. et al., 2008; Stavrakou et al., 2008; Bloomer et al., 2009, 2010; Fang et al., 2010]
Extreme value theory statistical methods enable derivation of “return levels” for JJA MDA8 O3within a given time window Return level = value (level) that occurs or is exceeded within a given time (period) CASTNet site: Penn Station, PA Fit using EVT methods for MDA8 O3>75 ppb 1988-1998 1999-2009 Observed MDA8 O3 • Sharp decline in return levels • between early and later periods • (NOx SIP call) • Consistent with prior work [e.g., Frost et al., 2006; Bloomer et al., 2009, 2010] • Translates air pollution changes into • probabilistic language Apply methods to all EUS CASTNet sites to derive 1-year return levels Rieder et al., ERL 2013
One-year return levels for JJA MDA8 O3 over EUS decrease following NOx emission controls 1999-2009 1988-1998 • 1-yr return level decreases by 2-16 ppb • 1-year levels remain above the NAAQS threshold (75 ppb) Rieder et al., ERL 2013
How will NE US surface O3 distributions evolve with future changes in emissions and climate? Tool: GFDL CM3 chemistry-climate model Donner et al., J. Climate, 2011; Golazet al., J. Climate, 2011; John et al., ACP, 2012 Turner et al., ACP, 2012 Naik et al., submitted Horowitz et al., in prep • ~2°x2°; 48 levels • Over 6000 years of climate simulations that include chemistry (air quality) • Options for nudging to re-analysis + global high-res ~50km2[Lin et al., JGR, 2012ab] Climate / Emission Scenarios: Representative Concentration Pathways (RCPs) Percentage changes from 2005 to 2100 Enables separation of roles of changing climate from changing air pollutants RCP8.5 RCP4.5 RCP4.5_WMGG NE USA NOx Global NOx Global CO2 Global CH4 Global T (°C) (>500 hPa)
Impact of changes in climate vs. emissions on surface O3 under moderate warming scenario over NE USA RCP4.5_WMGG 2006-2015 RCP4.5_WMGG 2091-2100 • RCP4.5 2006-2015 • RCP4.5 2091-2100 3 ensemble members for each scenario (2091-2100) – (2006-2015) RCP4.5_WMGG 3 ens. member mean: • Moderate climate change increases NE USA surface ozone up to 4 ppb RCP4.5 O3 change (ppb)(2091-2100)-(2006-2015) -5 -15 -25 -35 • But large regional NOx reductions fully offset this; • O3 decreases most for polluted conditions; • Seasonal cycle reverses 3 ensemble members 5% 10% 20% 30% 40% 50% 60% 70% 80% 90% 95% Percentile of JJA MDA8 O3 distribution
NE USA: surface O3 seasonal cycle reverses in CM3 with large regional NOx controls in RCP8.5 (extreme warming) ? NOx decreases Stratospheric O3 tracer Difference between RCP8.5and RCP8.5 but with CH4 held at 2005 levels indicates that doubling CH4increases surface O3 over NE by more than 5-10 ppb; Largest in winter Tracer of strat. O3 increases in winter-spring Recovery + climate-driven increase in STE? [e.g.,Butchart et al., 2006; Hegglin&Shepherd, 2009; Kawase et al., 2011; Li et al., 2008; Shindell et al. 2006; Zeng et al., 2010]
Summertime surface O3 variability aligns with the 500 hPa jet over Eastern N. America JJA MDA8 O3 and NOx emissions zonally averaged over Eastern N. America Jet Position MERRA CM3 GFDL CM3 model NOx emission peak aligns with highest mean observed + modeled MDA8 O3 Relative standard deviation max at the jet latitude Barnes & Fiore, in press, GRL
Peak latitude of summertime surface O3 variability over Eastern N. America follows the jet as climate warms RCP8.5: most warming, Largest jet shift RCP4.5_WMGG • Local O3:T relationships also follow the jet (not shown) • observed O3:T may not apply if large-scale circulation shifts Could different simulated jet positions explain cross-model disagreement in regional O3 response to climate change? Each point = 10 year mean (over all ensmble members where available) Barnes & Fiore, GRL, in press
‘First-look’ future projections with current chemistry-climate models for North American Ozone Air Quality Annual mean spatially averaged (land only) O3 in surface air Mean over 1986-2005 of CMIP5 CCMs Transient simulations (4 models) 1980+2000 mean of ACCMIP CCMs decadal time slice simulations (2-12 models) Range across all models Range across all models Multi- model Mean RCP8.5 RCP6.0 RCP4.5 RCP2.6 Multi-model Mean V. Naik, adapted from Fiore et al., 2012 Beyond annual, continental-scale means: Shifting balance of regional and baseline O3 changes seasonal cycles and daily distributions; Role of regional climate change?