Download
1 / 11
110 likes | 192 Views
Dissolved Oxygen Criteria Indicators. Dave Jasinski. Mainstem and Tidal Trib Attainment through time – by assessment period. Top Level – Mainstem and Tidal Trib Attainment. Mainstem and Tidal Trib OW Attainment through time – by assessment period.

E N D
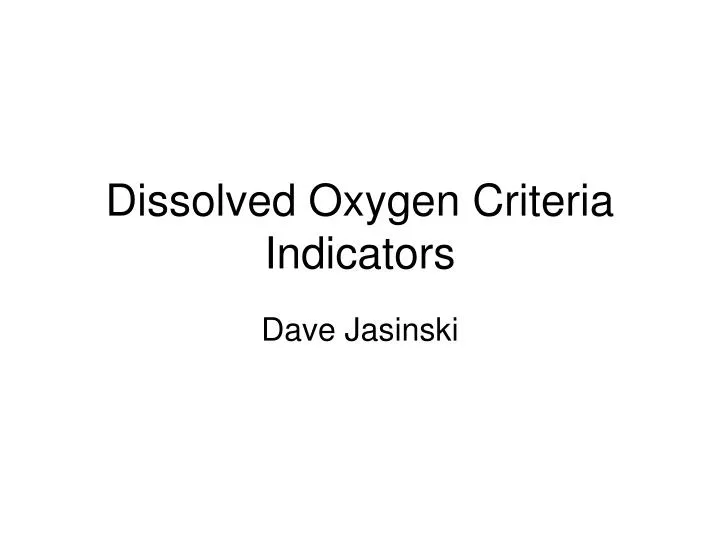
Dissolved Oxygen Criteria Indicators Dave Jasinski
Mainstem and Tidal Trib Attainment through time – by assessment period Top Level – Mainstem and Tidal Trib Attainment Mainstem and Tidal Trib OW Attainment through time – by assessment period Mainstem and Tidal Trib OW Attainment through time – by month Potomac Attainment through time – by assessment period Trib Level – Potomac Attainment Potomac DW Attainment through time – by assessment period Potomac DW Attainment through time – by month
Open Water Volume Deep Water Volume Deep Channel Volume Segment meeting proposed standards Segment not meeting proposed standards Volume of Chesapeake Bay And Tidal Tributaries meeting proposed water quality standards under 2001-2003 and restored conditions 100 19.3 15.4 80 • Data are expressed as a percentage of the total water volume of the Mainstem Bay and Tidal Tribs.Total Bay volume in this assessment – 73 km3 or 19.3 trillion gallons • This is the 2001-2003 June-September attainment assessment 60 11.6 Gallons meeting proposed water quality standards (x 1 trillion) Percent of total volume meeting proposed water quality standards 40 7.7 20 3.9 0 0 2001-2003 Restored 2010 Goal 2003 Open Water 2001-03 Maps Deep Water Deep Channel
Open Water Volume Deep Water Volume Deep Channel Volume Segment meeting proposed standards Segment not meeting proposed standards Volume of Chesapeake Bay And Tidal Tributaries meeting proposed water quality standards 19.3 100 15.4 80 • - Data are expressed as a percentage of the total water volume of the Mainstem Bay and Tidal Tribs. This volume varies by assessment period. For purposes of this graph, percentages were based on a mean volume of 73.16 km3 or 19.3 trillion gallons • Year on x axis is the end year of the 3 year assessment period (ie 1992 is the 1990-92 assessment) • 2010 is the projected condition of 100% of the volume meeting the proposed standards Percent of total volume meeting proposed water quality standards 11.6 60 Gallons meeting proposed water quality standards (x 1 trillion) 7.7 40 3.9 20 0 0 Open Water Deep Water Deep Channel
Segment meeting proposed standards Segment not meeting proposed standards Open Water volume meeting proposed water quality standards Open Water Volume Goal - Data are expressed as a percentage of the total Open Water volume of the Mainstem Bay and Tidal Tribs. This volume is approximately 50 km3 or 13 trillion gallons and is variable. - Year on x axis is the end year of the 3 year assessment period (ie 1992 is the 1990-92 assessment) Percent of OW volume meeting proposed water quality standards
Data displayed in the graph is the percent of the OW DU for each month that meets the Summer OW water quality standard of 5.0 mg/l. The OW volume is variable from cruise to cruise but on average is 47 km3 or 12,425,194,391,560 gallons • Maps show the area failing and passing for each month Percent of Mainstem and Tributary Open Water Designated Use Meeting the OW water quality standard (5.0 mg/l) by month Percent of Designated Use Volume Meeting Water Quality Standard June July August September 1985 1986 1987 1988 1989 1990 1991 1992 1993 1994 1995 1996 1997 1998 1999 2000 2001 2002 2003
Open Water Volume Deep Water Volume Deep Channel Volume Segment meeting proposed standards Segment not meeting proposed standards Volume of Potomac River meeting proposed water quality standards 1.8 100 1.5 80 • - Data are expressed as a percentage of the total water volume of the Potomac River. This volume varies by assessment period. For purposes of this graph, percentages were based on a mean volume of 7.12 km3 or 1.8 trillion gallons • Year on x axis is the end year of the 3 year assessment period (ie 1992 is the 1990-92 assessment) • 2010 is the projected condition of 100% of the volume meeting the proposed standards Percent of total volume meeting proposed water quality standards 1.1 60 Gallons meeting proposed water quality standards (x 1 trillion) .75 40 .37 20 0 0 Open Water Deep Water Deep Channel
Open Water Volume Deep Water Volume Deep Channel Volume Segment meeting proposed standards Segment not meeting proposed standards Volume of Potomac meeting proposed water quality standards under 2001-2003 and restored conditions 100 1.9 1.5 80 • Data are expressed as a percentage of the total water volume of the Potomac River.Total River volume in this assessment – 7.1 km3 or 1.9 trillion gallons • This is the 2001-2003 June-September attainment assessment 60 1.1 Gallons meeting proposed water quality standards (x 1 trillion) Percent of total volume meeting proposed water quality standards 40 0.7 20 0.4 0 0 2001-2003 Restored 2010 Goal 2003 Open Water 2001-03 Maps Deep Water Deep Channel
Data displayed in the graph is the percent of the DW DU for each month that meets the Summer DW water quality standard of 3.0 mg/l. The Potomac DW volume is variable from cruise to cruise but on average is 1.3 km3 or 340,215,366,570 gallons • Maps show the area failing and passing for each month Percent of Potomac Deep Water Designated Use Meeting the DW water quality standard (3.0 mg/l) by month Percent of Designated Use Volume Meeting Water Quality Standard June July August September 1985 1986 1987 1988 1989 1990 1991 1992 1993 1994 1995 1996 1997 1998 1999 2000 2001 2002 2003
Segment meeting proposed standards Segment not meeting proposed standards Volume of Potomac River Deep Water Designate Use meeting proposed water quality standards 3.14 100 Deep Water Volume 2.51 80 • - Data are expressed as a percentage of the total Deep Water volume of the Potomac. The Mean volume is approximately 1.25 km3 or 330billion gallons and is variable. • Year on x axis is the end year of the 3 year assessment period (ie 1992 is the 1990-92 assessment) • 2010 is the projected condition of 100% of the volume meeting the proposed standards Percent of DW volume meeting proposed water quality standards 1.88 60 Gallons meeting proposed water quality standards (x 100 billion) 1.27 40 0.63 20 0 0