Download
1 / 1
10 likes | 88 Views
GSE Rutgers University. NSF DRL-0733140.

E N D
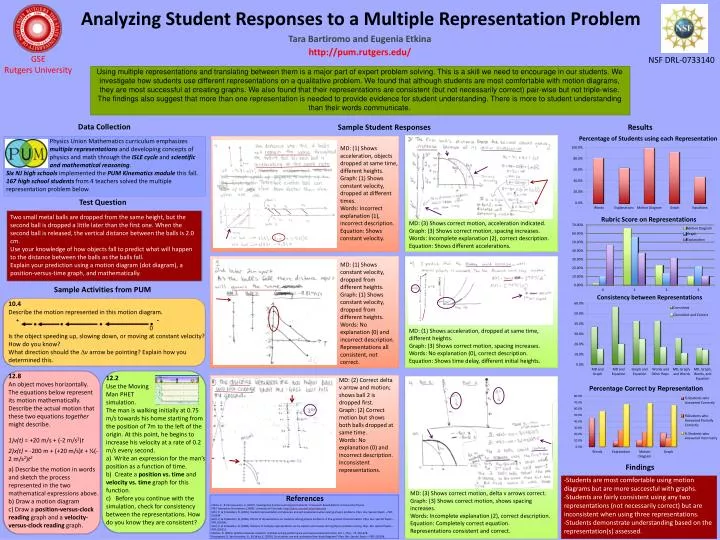
GSE Rutgers University NSF DRL-0733140 Using multiple representations and translating between them is a major part of expert problem solving. This is a skill we need to encourage in our students. We investigate how students use different representations on a qualitative problem. We found that although students are most comfortable with motion diagrams, they are most successful at creating graphs. We also found that their representations are consistent (but not necessarily correct) pair-wise but not triple-wise. The findings also suggest that more than one representation is needed to provide evidence for student understanding. There is more to student understanding than their words communicate. Data Collection Sample Student Responses Results Percentage of Students using each Representation Physics Union Mathematics curriculum emphasizes multiple representations and developing concepts of physics and math through the ISLE cycle and scientific and mathematical reasoning. Six NJ high schools implemented the PUM Kinematics module this fall. 167 high school students from 4 teachers solved the multiple representation problem below. MD: (1) Shows acceleration, objects dropped at same time, different heights. Graph: (1) Shows constant velocity, dropped at different times. Words: Incorrect explanation (1), incorrect description. Equation: Shows constant velocity. Analyzing Student Responses to a Multiple Representation Problem Test Question Two small metal balls are dropped from the same height, but the second ball is dropped a little later than the first one. When the second ball is released, the vertical distance between the balls is 2.0 cm. Use your knowledge of how objects fall to predict what will happen to the distance between the balls as the balls fall. Explain your prediction using a motion diagram (dot diagram), a position-versus-time graph, and mathematically. MD: (3) Shows correct motion, acceleration indicated. Graph: (3) Shows correct motion, spacing increases. Words: Incomplete explanation (2), correct description. Equation: Shows different accelerations. Consistency between Representations MD: (1) Shows constant velocity, dropped from different heights. Graph: (1) Shows constant velocity, dropped from different heights. Words: No explanation (0) and incorrect description. Representations all consistent, not correct. Sample Activities from PUM 10.4 Describe the motion represented in this motion diagram. + - 0 Is the object speeding up, slowing down, or moving at constant velocity? How do you know? What direction should the varrow be pointing? Explain how you determined this. Tara Bartiromo and Eugenia Etkina http://pum.rutgers.edu/ MD: (1) Shows acceleration, dropped at same time, different heights. Graph: (3) Shows correct motion, spacing increases. Words: No explanation (0), correct description. Equation: Shows time delay, different initial heights. • 12.8 • An object moves horizontally. The equations below represent its motion mathematically. Describe the actual motion that these two equations together might describe. • v(t) = +20 m/s + (-2 m/s2)t • x(t) = -200 m + (+20 m/s)t + ½(-2 m/s2)t2 • a) Describe the motion in words and sketch the process represented in the two mathematical expressions above. • b) Draw a motion diagram • c) Draw a position-versus-clock reading graph and a velocity-versus-clock reading graph. 12.2 Use the Moving Man PHET simulation. The man is walking initially at 0.75 m/s towards his home starting from the position of 7m to the left of the origin. At this point, he begins to increase his velocity at a rate of 0.2 m/s every second. a) Write an expression for the man’s position as a function of time. b) Create a position vs. time and velocity vs. time graph for this function. c) Before you continue with the simulation, check for consistency between the representations. How do you know they are consistent? MD: (2) Correct delta v arrow and motion; shows ball 2 is dropped first. Graph: (2) Correct motion but shows both balls dropped at same time. Words: No explanation (0) and incorrect description. Inconsistent representations. Percentage Correct by Representation • Findings • Students are most comfortable using motion diagrams but are more successful with graphs. • Students are fairly consistent using any two representations (not necessarily correct) but are inconsistent when using three representations. • Students demonstrate understanding based on the representation(s) assessed. MD: (3) Shows correct motion, delta v arrows correct. Graph: (3) Shows correct motion, shows spacing increases. Words: Incomplete explanation (2), correct description. Equation: Completely correct equation. Representations consistent and correct. References Etkina, E., & Van Heuvelen, A. (2007). Investigative Science Learning Environment. In Research Based Reform of University Physics PhET Interactive Simulations. (2009). University of Colorado: http://phet.colorado.edu/index.php Kohl, P., & Finkelstein, N. (2005). Student representation competence and self-assessment when solving physics problems. Phys. Rev. Special Topics – PER, 010104. Kohl, P., & Finkelstein, N. (2006). Effects of representation on students solving physics problems: A fine-grained characterization. Phys. Rev. Special Topics – PER, 010106. Kohl, P., & Finkelstein, N. (2008). Patterns of multiple representation use by experts and novices during physics problem solving. Phys. Rev. Special Topics – PER, 010111. Meltzer, D. (2005). Relation between students’ problem-solving performance and representational format. Am. J. Phys., 73, 463-478. Rosengrant, D. Van Heuvelen, A., & Etkina, E. (2009). Do students use and understand free-body diagrams? Phys. Rev. Special Topics – PER, 010108.