Download
1 / 34
340 likes | 347 Views
This presentation provides an overview and fall 2006 results of the Controlled Hydrogen Fleet and Infrastructure Demonstration and Validation Project. The project aims to validate hydrogen fuel cell vehicles and infrastructure, assess progress towards technology readiness, and provide data analysis for both the public and industry.

E N D
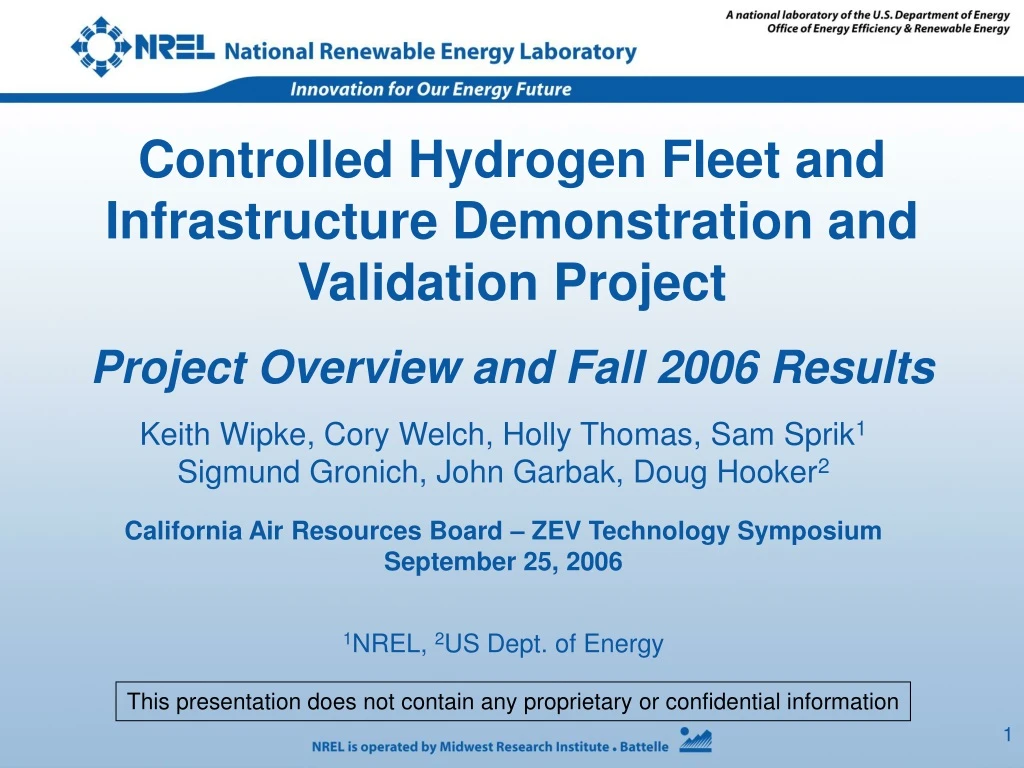
Controlled Hydrogen Fleet and Infrastructure Demonstration and Validation ProjectProject Overview and Fall 2006 Results Keith Wipke, Cory Welch, Holly Thomas, Sam Sprik1 Sigmund Gronich, John Garbak, Doug Hooker2 California Air Resources Board – ZEV Technology Symposium September 25, 2006 1NREL, 2US Dept. of Energy This presentation does not contain any proprietary or confidential information
Disclaimer and Government License • This work has been authored by Midwest Research Institute (MRI) under Contract No. DE-AC36-99GO10337 with the U.S. Department of Energy (the “DOE”). The United States Government (the “Government”) retains and the publisher, by accepting the work for publication, acknowledges that the Government retains a non-exclusive, paid-up, irrevocable, worldwide license to publish or reproduce the published form of this work, or allow others to do so, for Government purposes. • Neither MRI, the DOE, the Government, nor any other agency thereof, nor any of their employees, makes any warranty, express or implied, or assumes any liability or responsibility for the accuracy, completeness, or usefulness of any information, apparatus, product, or process disclosed, or represents that its use would not infringe any privately owned rights. Reference herein to any specific commercial product, process, or service by trade name, trademark, manufacturer, or otherwise does not constitute or imply its endorsement, recommendation, or favoring by the Government or any agency thereof. The views and opinions of the authors and/or presenters expressed herein do not necessarily state or reflect those of MRI, the DOE, the Government, or any agency thereof.
Outline • Project Objectives and Overview • Industry Partners; H2 vehicles and stations • Process and Methodology for Making Results Public • Key Fall 2006 Results • Vehicles • Net fuel cell system efficiency • Fuel economy and range • Safety • H2 Refueling Infrastructure • Refueling Rates • Safety • H2 station purity and impurities • Maintenance • High-level project status metrics • Summary and Future Results
Project Objectives and Targets Hydrogen refueling station, Chino, CA Photo: NREL • Objectives • Validate H2 FC Vehicles and Infrastructure in Parallel • Identify Current Status of Technology and its Evolution • Assess Progress Toward Technology Readiness • Re-Focus H2 Research and Development Key Targets
Teams are Fielding Four Main Types of Vehicles Validation also includes FCV Sprinter vans
Number of Learning Demo Vehicles in Operation H2 Storage Technologies Used 63 ~1/2 of project vehicles have been deployed. Additional vehicles will include 2nd generation systems and some additional 1st generation.
Representative Hydrogen Refueling Infrastructure Supporting Vehicles DTE/BP Power Park, Southfield, MI LAX refueling station Hydrogen and gasoline station, WA DC Chino, CA
Number and Type of Learning DemoHydrogen Refueling Stations Online ~1/2 of stations are producing H2 on-site ~1/2 of 20 planned refueling stations are online 4 9
Refueling Stations from All Four Teams Test Vehicle/Infrastructure Performance in Various Climates Additional Planned Stations (4) Additional Planned Stations (2) Additional Planned Stations (2) Northern California SE Michigan Mid-Atlantic Florida Southern California Additional Planned Stations (3) Ap-07-06
Providing Data Analysis and Results for Both the Public and for the Industry Project Teams Hydrogen Secure Data Center (HSDC) Composite Data Products • Located at NREL: Strictly Controlled Access • Detailed Analyses, Data Products, Internal Reports • Pre-agreed upon aggregate data results for public Raw Data, Reports • No confidential information Detailed Data Products Data is delivered to NREL’s Hydrogen Secure Data Center (HSDC) on CD/DVDs • Only shared with company which originated the data Data protected in HSDC for 5 years after data is developed under EPACT 2005, Sec. 810
Five Quarters of Data AnalyzedCurrent Status of Data Reporting to the Hydrogen Secure Data Center at NREL Through September, 2006: 76,000 individual vehicle trips 27 GB of on-road data
Analysis Calculations and Results are fromNREL-Developed GUI – Fleet Analysis Toolkit (FAT) PUBLISH TripView Not Real Data Not Real Data
After Industry and DOE Review, Composite Data Products are Published in Hydrogen/Vehicle Conferences Spring 2006 National Hydrogen Association Conference March 13, 2006 Fall 2006 EVS-22 Conference October 26, 2006 Fuel Cell Seminar November 15, 2006 All public Learning Demo papers and presentations are available online at http://www.nrel.gov/hydrogen/proj_tech_validation.html
Quantity of Project Results Continues to Increase; Updates Every Six Months Fall 2006 Spring 2006 24 Composite Data Products Have Now Been Published, Including Updating Many of the 16 Published in Spring 2006
Controlled System Tests Verify High Fuel Cell System Conversion Efficiency In-Vehicle Fuel Cell System Efficiencies Ranged Between 52.5% and 58.1%, very close to DOE target of 60% Results obtained from steady-state vehicle chassis dynamometer tests at roughly ¼ power
Dynamometer and On-Road Fuel Economy from Learning Demonstration Vehicles
Vehicle Range Based on Dyno Results and Usable H2 Fuel Stored On-Board Note: This is calculated based on unadjusted dyno result. “Window-sticker” range is ~15% lower. Data indicate improved H2 storage technologies capable of being packaged in a vehicle are necessary to meet range targets
Effective Vehicle Range Reduced from Dyno Range by On-Road Fuel Economy Vehicle Range Factor = (on-road fuel economy) / (dyno fuel economy) Real-world on-road fuel economy is 63-75% of dyno fuel economy This translates directly into a 25-37% reduction in effective real-world range
Learning Demo Data Show Actual Refueling Behavior as % of Theoretical 95% of refuelings done at <65% of dyno range 50% of refuelings done at <35% of dyno range Dyno-range
Technical Status of On-Board H2 Storage Technologies Being Validated Compressed and liquid H2 tanks meet durability and short term weight %, but don’t meet long-term weight % or volumetric capacity targets for vehicles
Safety Incidents – Vehicles Strong vehicle safety record indicates very few start-up issues and no fundamental safety problems with the vehicles
Actual Vehicle Refueling Rates from >2000 Events: Measured by Stations or by Vehicles Future analyses could compare impact of communication and non-communication fills on fill rates and completeness of fill Average rate: 0.69 kg/min Median: 0.72 kg/min 18% of refueling events exceeded 1kg/min
Safety Incidents – Infrastructure H2 releases have been minor and related to startup issues Station robustness to external forces and false alarms could be improved.
Hydrogen Purity Sampled from Stations Close to Target Majority of the Time Relatively high impurity detection limits affect calculated purity results
Hydrogen Impurities Sampled from All Stations – Includes On-Site Reformation, Electrolysis, and Delivered H2 High detection limits introduce larger uncertainty about meeting SAE targets
Unscheduled H2 Refueling Infrastructure Maintenance ~50-60% of Total
Range of Ambient TemperatureDuring Vehicle Operation Fuel cell vehicles are currently able to operate in extreme temperature conditions. Future tests will determine ability to start in cold temperatures.
Vehicle Operating Hours and Miles Traveled Distribution The bulge of operating hours and miles traveled is now shifting to the right. New Gen 1 vehicles continue to be introduced, but 2nd bulge will appear at left with Gen 2 vehicle introduction.
Cumulative Vehicle Miles Traveled and Mass of H2 Produced or Dispensed Current deployment of new H2 refueling stations for this project is about 50% complete. Many mobile refuelers will be replaced with on-site generation Rate of mileage accumulation increasing as initial fleets approach full Gen 1 vehicle deployment
Methodology for Projecting Stack Durability–Results to be Published this Fall Not Real Data Not Real Data Not Real Data Technique Makes Performance Projection Based on All Available FC Data; Includes Reporting Confidence in Results Voltage Degradation Analysis Technique Key to Evaluating Data Relative to DOE FC Durability Target in Fall 2006
Summary • First 5-quarters of project completed • 63 vehicles now in fleet operation • Several new refueling stations opened • No major safety problems encountered • Total of 24 composite data products published • Project has identified current technical status relative to program targets • Will track improvements from 2nd generation stacks/vehicles introduced mid-way through project • Future public results will include: • 6-month updates to existing composite data products • Fuel cell durability* and cold start-up times • H2 production cost and efficiency • Other composite data products created based on insights learned *To be presented at EVS-22 and Fuel Cell Seminar
Questions and Discussion Contact: Keith Wipke, National Renewable Energy Lab 303.275.4451 keith_wipke@nrel.gov All papers and presentations are available online at http://www.nrel.gov/hydrogen/proj_tech_validation.html